Common Types of Analysis That Help Assess a Company’s Performance
Doownload fully automated company performance evaluation ⬇️
Understanding a company’s performance is rarely as straightforward as it seems. At first glance, strong revenue or rising profit may suggest success. Yet, with a closer look, a different reality often emerges. Growth can hide inefficiencies. Profit can coexist with cash shortages. Stability can sometimes signal a lack of innovation.
A company, much like a living system, evolves through constant adjustments—between ambition and constraint, opportunity and risk. To grasp that reality, one must go beyond isolated figures and adopt several complementary ways of reading performance. Each type of analysis reveals a specific layer. Together, they form a coherent understanding.
Financial Ratio Analysis — Making Numbers Speak
Financial ratios offer a first entry point. They turn raw accounting data into signals that are easier to interpret.
Some ratios focus on profitability, helping answer a simple question: is the company truly creating value from its activity? Others examine liquidity, revealing whether the company can meet its short-term obligations without strain. Solvency ratios extend the view further, highlighting how sustainable its level of debt is. Efficiency ratios, in turn, show how well the company uses its resources.
Taken individually, each ratio tells only part of the story. A company may be profitable yet fragile in terms of liquidity. Another may be financially stable but inefficient in its operations. What matters lies in the combination, and in the tensions that appear between these indicators.
Ratios do not deliver conclusions. They guide attention toward what deserves to be understood more deeply.
Horizontal Analysis — Following the Company Over Time
A single year rarely reveals much. What truly matters is how the company evolves.
Horizontal analysis compares figures across several periods, allowing patterns to emerge. It becomes possible to see whether growth is steady or irregular, whether costs are controlled or drifting, whether profitability improves or erodes.
A business may show increasing revenue year after year. That seems reassuring. Yet if expenses rise faster, the underlying situation weakens quietly. This kind of shift often escapes notice without a longitudinal view.
Time adds meaning to numbers. It transforms isolated results into a trajectory.
Vertical Analysis — Seeing the Internal Balance
Vertical analysis changes perspective. Instead of looking at absolute values, it focuses on proportions.
Each item in a financial statement is expressed as a share of a total. Costs are measured relative to revenue. Assets are viewed in relation to total resources. This makes it easier to understand how the company is structured.
Certain imbalances become visible through this lens. A large share of expenses may limit profitability. A high level of inventory may indicate inefficiency or weak demand. A heavy reliance on debt may reduce flexibility.
This approach does not ask how much the company earns. It asks how that earning is distributed.
Cash Flow Analysis — Returning to Reality
Profit is an important measure, yet it remains influenced by accounting rules. Cash flow brings the analysis back to something more concrete: money actually moving through the business.
Operating cash flow reflects the strength of the company’s core activity. Investing cash flow shows how it prepares for the future. Financing cash flow reveals how it funds its choices.
A company may appear profitable while struggling to generate cash. This situation often creates pressure, especially when obligations must be met in the short term. On the other hand, a company with steady cash generation tends to show resilience, even when profits fluctuate.
Cash flow reminds us that performance is not only about results on paper, but about the ability to sustain operations day after day.
Break-Even Analysis — Understanding the Threshold
Every company has a threshold where loss gives way to profit, and break-even analysis helps identify it. It shows the level of activity needed to cover costs, bringing greater clarity to decisions about pricing, production, and growth.
At the same time, it reveals the company’s exposure to risk. A business that must sell large volumes to break even is more vulnerable to small shifts in demand, while a lower threshold offers greater flexibility.
In this way, break-even analysis keeps strategic thinking closely tied to economic reality.
Variance Analysis — Learning From Differences
Plans are built on expectations. Reality often introduces variation.
Variance analysis compares what was planned with what actually happened. The difference can be small or significant, temporary or structural. Understanding that difference is what matters.
A higher cost than expected may come from external factors, such as rising prices. It may also reflect inefficiency. A lower-than-expected revenue may indicate a shift in demand or a weakness in execution.
This type of analysis encourages learning. It transforms performance into a process of adjustment and improvement rather than a fixed outcome.
Benchmarking — Placing Performance in Context
A company’s performance gains meaning when compared with others.
Benchmarking introduces this external perspective. It compares key indicators—margins, costs, productivity—with those of competitors or industry averages.
This often changes perception. A company that appears efficient internally may lag behind its peers. Another may discover that it holds a competitive advantage it had not fully recognised.
🟨 Performance is always relative. Context gives it depth.
It examines the company through four angles: strengths, weaknesses, opportunities, and threats. Some factors come from within the company, others from its environment.
A business may perform well financially while facing a declining market. Another may struggle in the short term while building capabilities for future growth.
SWOT analysis connects performance to context. It introduces a broader understanding that numbers alone cannot provide.
Cost-Benefit Analysis — Clarifying Decisions
Every strategic decision involves trade-offs, as choosing one direction often means giving up another. In this sense, cost-benefit analysis brings clarity by making these compromises explicit.
It compares expected benefits with the resources required, whether for launching a product or investing in equipment, ensuring decisions remain grounded in reality.
While it does not eliminate uncertainty, it helps structure it. As a result, decision-making becomes more thoughtful and balanced.
Trend and Forecast Analysis — Looking Ahead
Understanding the past matters. Anticipating the future matters even more. Trend analysis identifies patterns in historical data. Forecasting extends those patterns into the future, providing a basis for planning.
No forecast is certain. Yet having a structured expectation allows the company to prepare, allocate resources, and reduce uncertainty. This forward-looking perspective transforms analysis into guidance.
Bringing Everything Together
Each type of analysis offers a different way of understanding the company:
Ratios highlight financial condition
Cash flow reveals operational reality
Trends show direction
Benchmarking adds comparison
SWOT connects everything to strategy
On their own, they remain partial. Together, they create coherence.
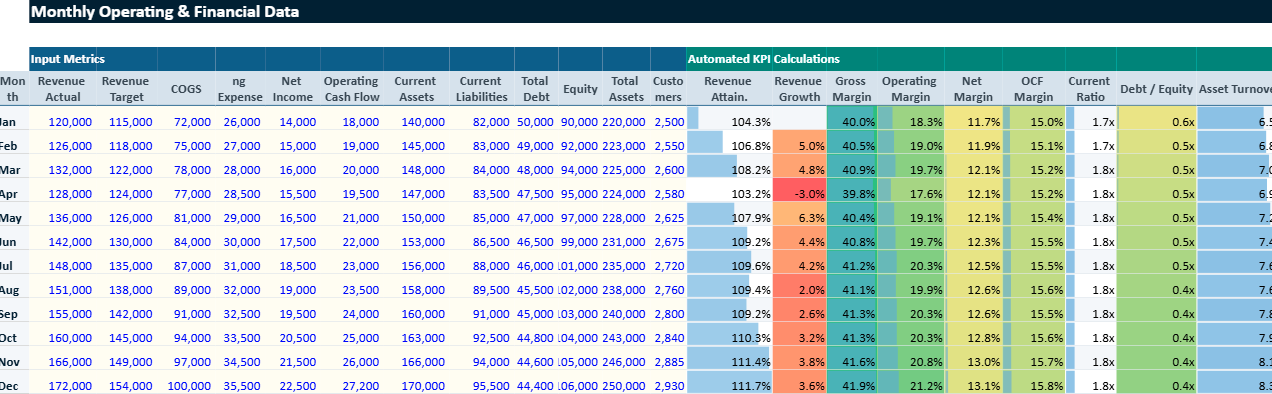
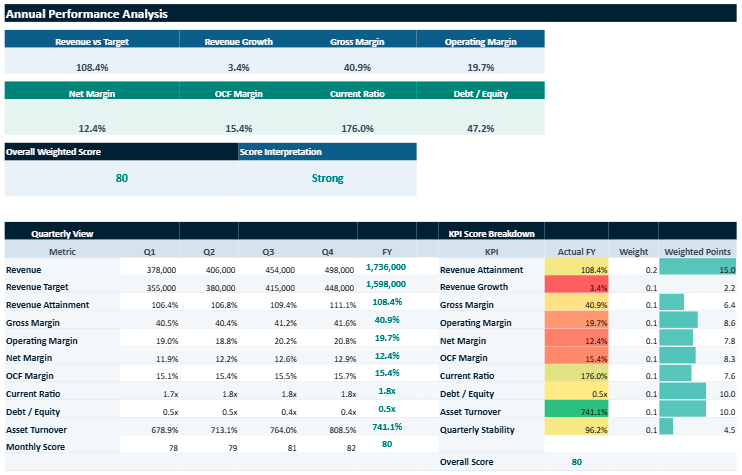
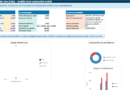
Company Performance Dashboard & Automated Analysis Tool 📊
This Excel file is designed as a practical tool for evaluating a company’s performance in a clear and structured way. It brings together data entry, automatic calculations, and visual reporting in one place, so the user can move from raw figures to a more readable view of the business.
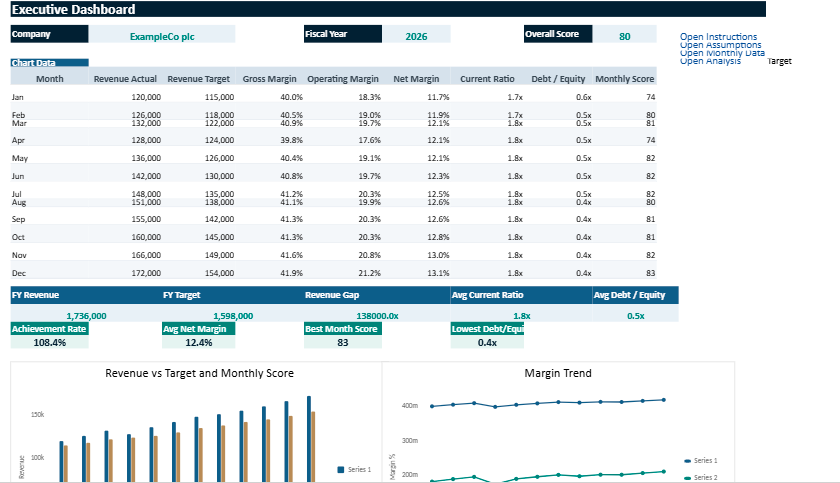
The model makes it possible to enter monthly data, follow key indicators automatically, and view the results through a dashboard with charts and performance highlights. Its layout has been built to remain easy to use while still looking polished and professional.
In concrete terms, the file helps track how the company is evolving, spot strong areas, detect weaker points, and support more informed decisions. It is therefore not just a spreadsheet, but a working tool meant to make performance analysis more accessible, more visual, and more useful in day-to-day management.
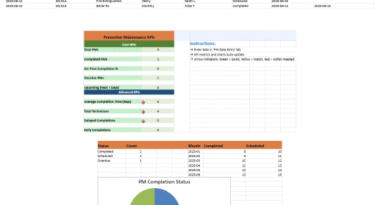
In today’s fast-paced industrial and facilities management landscape, data-driven decision-making is no longer a luxury—it’s a necessity. Maintenance teams are
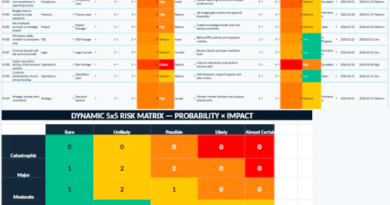
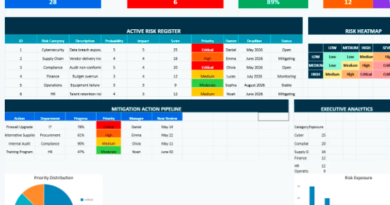
A Refined Approach to Risk Visibility, Strategic Control and Operational Stability Behind the apparent stability of many organizations, uncertainty constantly