P&L Example in Excel | Multicolor Profit and Loss Statement Template with Dashboard
Money rarely disappears all at once inside a business. In most companies, financial pressure builds quietly through dozens of small decisions: rising supplier costs, subscriptions multiplying over time, payroll expansion, underpriced services, declining margins, or seasonal fluctuations that slowly reduce available cash. Revenue may continue to grow while profitability weakens underneath the surface. That contrast explains why the Profit and Loss statement — often called the P&L statement or income statement — remains one of the most important management tools in modern business.
A well-structured P&L transforms financial activity into a readable operational story. Instead of looking at isolated invoices or bank movements, decision-makers gain a broader understanding of how revenue interacts with expenses, how margins evolve, and where profitability truly originates. In practical terms, a P&L statement helps answer critical questions:
- Is the business genuinely profitable?
- Which expenses consume the largest share of revenue?
- Are margins improving or deteriorating?
- How much operating income remains after fixed costs?
- Which months create financial pressure?
- Can the company sustain growth without damaging cash flow?
That is precisely why Excel remains widely used for P&L management. Its flexibility allows businesses to build dynamic financial models adapted to their own structure, industry, and reporting style. Whether used by freelancers, startups, agencies, retailers, manufacturers, consultants, or service companies, Excel provides a practical environment for organizing financial data into actionable insights.
What Is a P&L Statement?
A Profit and Loss statement summarizes a company’s revenues, costs, and expenses over a specific period. Its objective is simple: measure profitability.
At its core, the statement follows a logical financial sequence:
| Financial Component | Purpose |
|---|---|
| Revenue | Money generated from sales or services |
| Cost of Goods Sold | Direct costs tied to production or delivery |
| Gross Profit | Revenue after direct costs |
| Operating Expenses | Administrative and operational spending |
| Operating Income | Profit generated by core operations |
| Taxes & Interest | Financial obligations |
| Net Profit | Final earnings remaining |
The structure may appear straightforward, yet the interpretation behind each figure often reveals the true health of a business.
A company generating strong revenue may still experience operational fragility if expenses expand faster than income. Conversely, a smaller company with disciplined cost management may achieve healthier margins and stronger long-term stability.
Why Businesses Use Excel for P&L Reporting
Large corporations frequently rely on ERP systems and financial software, yet Excel continues to dominate day-to-day financial analysis for one essential reason: adaptability.
An Excel-based P&L can evolve instantly according to operational needs.
A startup may track:
- marketing acquisition costs,
- SaaS subscriptions,
- investor runway,
- payroll growth.
A retail business may focus on:
- inventory turnover,
- seasonal sales,
- supplier margins,
- logistics expenses.
A freelancer may simply need:
- monthly income tracking,
- tax estimation,
- project profitability,
- expense categorization.
Excel accommodates all of these realities without forcing rigid accounting structures.
Additionally, Excel enables:
- automated calculations,
- dashboards,
- visual KPI monitoring,
- forecasting scenarios,
- monthly comparisons,
- conditional formatting,
- dynamic charts.
The result becomes more than a static accounting document. It evolves into a financial decision-making system.
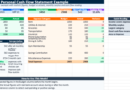
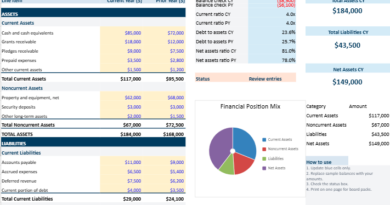
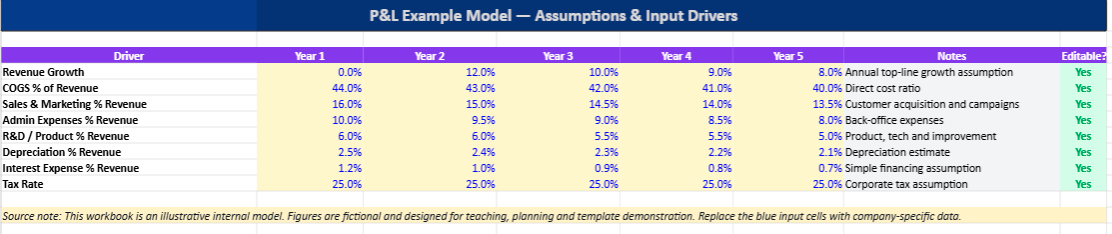
Structure of the Excel P&L Example
The Excel example included in this model follows a practical business-oriented structure designed for readability and analysis.
Revenue Section
The top section focuses on income generation. This area tracks all operating revenue sources.
Typical categories include:
- Product Sales
- Service Revenue
- Consulting Fees
- Subscription Income
- Licensing Revenue
This part allows managers to immediately evaluate revenue concentration and growth patterns.
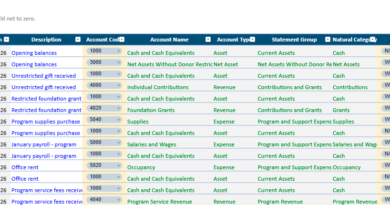
Cost of Goods Sold (COGS)
Direct operational costs appear underneath revenue.
These expenses generally include:
- raw materials,
- production costs,
- supplier expenses,
- packaging,
- shipping directly linked to sales,
- subcontracting tied to delivery.
Subtracting COGS from revenue produces Gross Profit.
Gross profit acts as a major profitability indicator because it measures operational efficiency before overhead expenses enter the equation.
Operating Expenses
Operating expenses often reveal the true managerial discipline of a business.
The Excel model organizes costs into categories such as:
- Salaries
- Rent
- Utilities
- Software Subscriptions
- Advertising
- Insurance
- Office Expenses
- Marketing
- Professional Services
This structure allows businesses to quickly identify expense inflation and monitor budget stability month after month.
Net Profit Calculation
After operating expenses, taxes, and additional financial costs are deducted, the statement calculates Net Profit.
This figure represents the company’s actual earnings.
Positive net profit generally indicates:
- operational sustainability,
- healthy pricing,
- balanced expenses,
- controlled growth.
Negative profit may signal:
- underpricing,
- excessive overhead,
- declining margins,
- operational inefficiencies,
- poor forecasting.
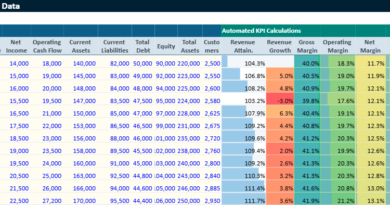
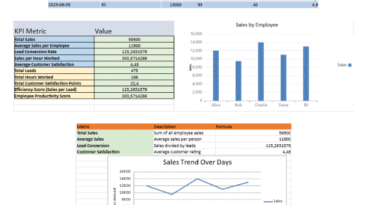
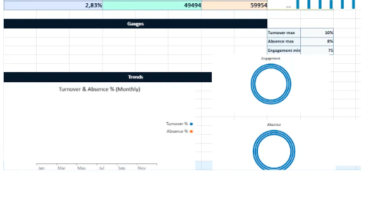
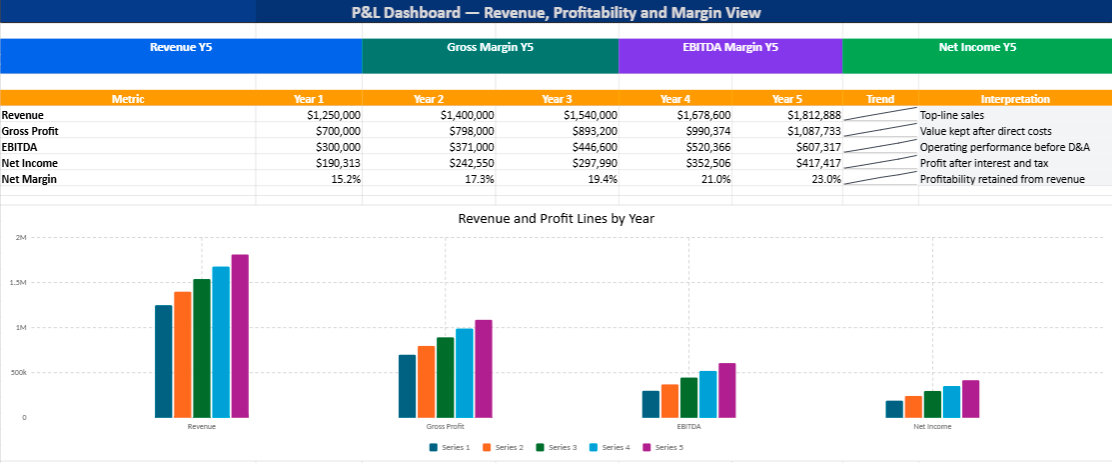
Why Visual Dashboards Matter
Traditional accounting reports often overwhelm non-financial users. Numbers alone rarely communicate urgency or performance trends clearly.
That explains the growing popularity of dashboard-driven P&L models.
The Excel example integrates visual elements such as:
- KPI cards,
- profit margin indicators,
- revenue evolution charts,
- expense distribution visuals,
- profitability trends.
These visual layers improve interpretation dramatically.
A manager can instantly identify:
- margin deterioration,
- unusual spending spikes,
- seasonal fluctuations,
- profitable periods,
- weak operational segments.
Financial visibility becomes faster, clearer, and significantly more actionable.
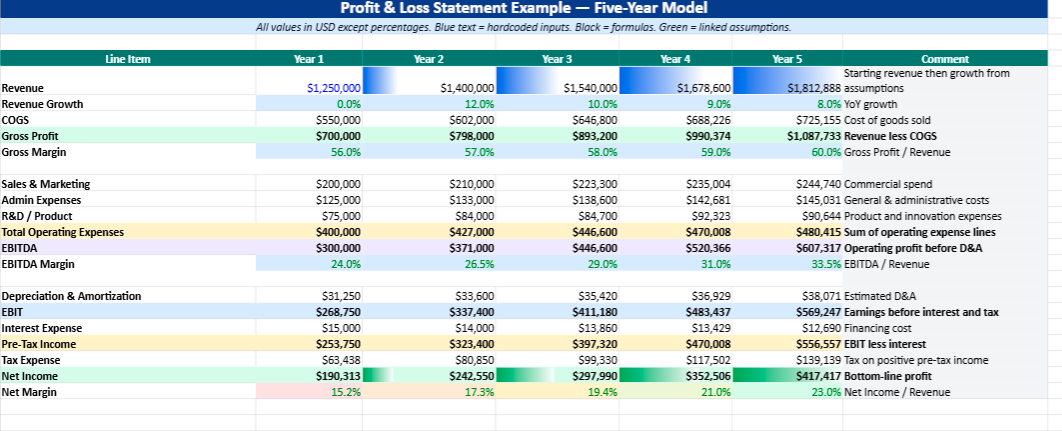
Practical Example of P&L Interpretation
Imagine a consulting company generating £480,000 in annual revenue.
At first glance, performance appears strong. However, after examining the P&L:
- payroll increased by 24%,
- advertising costs doubled,
- software subscriptions accumulated,
- contractor expenses expanded,
- travel costs rose significantly.
Revenue grew by 12%, yet net profit declined by 9%.
Without a structured P&L statement, management might wrongly assume the business is improving simply because sales increased.
The Excel model exposes the operational reality beneath the revenue figures.
This is where financial reporting becomes strategic rather than administrative.
Benefits of a Multicolor Financial Model
Color design inside Excel is often underestimated. Yet visual organization substantially improves usability.
The multicolor structure included in this P&L example helps separate:
- income categories,
- cost sections,
- KPIs,
- totals,
- formulas,
- editable cells.
The result feels more intuitive and less intimidating, particularly for users without an accounting background.
Well-designed financial spreadsheets improve:
- readability,
- data entry accuracy,
- reporting speed,
- collaboration between teams,
- presentation quality.
A visually structured workbook also encourages more consistent financial monitoring over time.
Who Can Use This P&L Excel Template?
This type of model adapts to multiple business profiles.
Freelancers
Track income, taxes, and monthly profitability.
Startups
Monitor burn rate, operating expenses, and scaling costs.
Agencies
Measure project profitability and recurring expenses.
Retail Businesses
Analyze margins, inventory costs, and operational efficiency.
Consultants
Track service revenue and business overhead.
Small Businesses
Build monthly financial reporting without expensive accounting software.
Common Mistakes in P&L Management
Many businesses produce P&L statements but still struggle financially because the document is treated as a passive accounting requirement rather than an operational tool.
Several recurring mistakes appear frequently:
Ignoring Small Recurring Expenses
Minor subscriptions and fragmented expenses gradually reduce profitability.
Focusing Only on Revenue
Revenue growth without margin control often creates hidden fragility.
Mixing Personal and Business Expenses
This distorts profitability analysis and weakens forecasting accuracy.
Reviewing Financials Too Late
Quarterly or annual analysis delays corrective action.
Overlooking Seasonal Variations
Businesses with cyclical activity require monthly comparison structures.
The Excel model helps reduce these risks through organized monthly tracking and visual reporting.
Why Financial Clarity Creates Better Decisions
Financial confusion creates hesitation. Clear financial reporting creates confidence.
Businesses operating without visibility often:
- delay investments,
- misprice services,
- overhire,
- underestimate costs,
- struggle with cash pressure.
A structured P&L introduces measurable operational clarity.
Managers begin understanding:
- where money originates,
- where profitability disappears,
- which activities generate value,
- which costs require optimization.
That clarity frequently changes the quality of strategic decisions more than revenue growth itself.
Final Thoughts
A Profit and Loss statement is far more than a formal accounting document. Properly structured, it becomes a financial navigation system capable of guiding operational decisions, pricing strategies, hiring plans, and long-term growth.
Excel remains one of the most effective tools for this purpose because it combines flexibility, visualization, automation, and accessibility inside a familiar environment.
The multicolor P&L example developed here offers a practical framework for understanding business profitability in a clearer and more visual way. Beyond formulas and totals, it provides something many businesses quietly lack: financial perspective.
Once numbers become readable, financial management becomes significantly more intelligent.
How to Use the P&L Excel Template
This multicolor Excel P&L template helps track revenue, expenses, margins, and profitability through automated calculations and visual dashboards 📊
1. Open the P&L Statement Sheet
The main worksheet contains:
- Revenue
- Direct Costs (COGS)
- Operating Expenses
- Net Profit
Color-coded sections improve readability and simplify data entry.
2. Enter Revenue Data
Fill in your monthly income figures such as:
- Product Sales
- Service Revenue
- Consulting Income
The template automatically calculates:
- Total Revenue
- Gross Profit
- Profit Margins
3. Add Expenses
Complete the expense categories:
- Salaries
- Rent
- Advertising
- Software
- Utilities
- Insurance
The workbook instantly updates profitability indicators.
4. Review the Dashboard
The Dashboard sheet displays:
- Revenue charts
- Expense trends
- KPI cards
- Profit analysis
This visual overview helps identify:
- profitable months,
- rising costs,
- margin changes,
- operational trends.
5. Understand the Colors
| Color | Meaning |
|---|---|
| Blue | Revenue sections |
| Orange | Expenses |
| Green | Positive results |
| Red | Losses or alerts |
| Grey | Automatic formulas |
6. Update Monthly
For better financial visibility:
- Enter monthly revenue
- Update expenses
- Review KPIs
- Monitor margins
Regular updates improve budgeting and financial decision-making.


: Investment, Taxation, and Property Management")