Measuring Marketing Performance in Excel
Building a Dynamic, Automated and Visually Powerful Dashboard for Modern Marketing Teams
Marketing performance no longer revolves around intuition alone. Every campaign, every click, every conversion and every euro invested now leaves behind measurable signals. Companies that succeed in digital environments are often those capable of transforming fragmented data into clear operational decisions.
Excel remains one of the most accessible and powerful tools for this mission.
Far beyond traditional spreadsheets, modern Excel dashboards now allow marketing departments to monitor campaigns in real time, automate calculations, visualize performance trends and centralize strategic indicators inside a single intelligent workspace.
A well-designed marketing dashboard becomes more than a reporting file. It evolves into a command center capable of revealing what truly drives growth.
Why Marketing Performance Tracking Matters
Marketing teams simultaneously manage multiple channels:
- Google Ads campaigns
- Social media advertising
- SEO performance
- Email marketing
- Landing pages
- Lead generation funnels
- CRM activities
- Sales conversions
Without a structured tracking system, performance analysis quickly becomes fragmented.
An automated Excel dashboard helps organizations:
- identify profitable campaigns faster
- reduce wasted advertising budgets
- improve customer acquisition strategies
- monitor conversion quality
- compare channels objectively
- detect declining performance early
- support faster executive decisions
This explains why dynamic Excel dashboards remain heavily used by startups, agencies, SMEs and enterprise marketing departments alike.
What a Modern Marketing Dashboard Should Include
An advanced marketing performance workbook usually combines several intelligent modules.
Campaign Tracking Area
This section centralizes:
| Campaign | Platform | Budget | Clicks | Leads | Conversions | ROAS |
|---|---|---|---|---|---|---|
| Summer Promotion | Google Ads | €1,500 | 4,200 | 340 | 52 | 4.8 |
| Product Launch | Meta Ads | €950 | 2,900 | 210 | 33 | 3.6 |
| Newsletter Campaign | Emailing | €300 | 1,400 | 180 | 27 | 5.2 |
This overview immediately highlights which campaigns generate the strongest returns.
Essential Marketing KPIs to Monitor
A powerful Excel dashboard should automatically calculate the following indicators.
Conversion Rate
Measures the percentage of visitors completing a desired action.
\text{Conversion Rate} = \frac{\text{Conversions}}{\text{Visitors}} \times 100
Cost Per Lead (CPL)
Shows how much each lead costs.
\text{CPL} = \frac{\text{Marketing Spend}}{\text{Number of Leads}}
Return on Ad Spend (ROAS)
One of the most critical metrics for paid advertising.
\text{ROAS} = \frac{\text{Revenue Generated}}{\text{Advertising Cost}}
Visual Elements That Transform Excel Dashboards
Modern dashboards rely heavily on visual clarity.
The most effective marketing dashboards often include:
- KPI cards
- dynamic charts
- circular gauges
- conversion funnels
- traffic heatmaps
- automated alerts
- campaign timelines
- conditional formatting
- performance trend indicators
These visual components allow managers to interpret complex information within seconds.
Automated Features That Increase Efficiency
Automation dramatically improves productivity.
An advanced Excel marketing dashboard may include:
Automated Data Consolidation
Data imported from:
- Google Ads
- Meta Ads
- CRM exports
- email marketing tools
- Google Analytics
Dynamic Filters
Users can instantly filter:
- campaign types
- acquisition channels
- regions
- product categories
- sales teams
- date ranges
Smart Conditional Formatting
Excel automatically highlights:
- profitable campaigns in green
- declining KPIs in orange
- critical performance drops in red
Email Marketing Tracking Dashboard
Email campaigns continue to generate strong ROI when properly monitored.
An automated emailing dashboard may track:
| KPI | Purpose |
|---|---|
| Open Rate | Subject line effectiveness |
| Click Rate | Engagement quality |
| Bounce Rate | Email quality |
| Unsubscribe Rate | Audience satisfaction |
| Conversion Rate | Campaign profitability |
Such dashboards help marketing teams refine segmentation and optimize future campaigns.
Google Ads Excel Dashboard
Paid advertising campaigns require continuous monitoring.
A Google Ads dashboard usually tracks:
- impressions
- clicks
- CTR
- CPC
- CPA
- conversions
- advertising spend
- ROAS
This allows advertisers to identify which campaigns deserve additional investment and which should be paused or redesigned.
Combining Marketing and Sales Performance
The most advanced dashboards connect marketing activity with commercial results.
This creates a unified performance ecosystem where teams can visualize:
| Marketing | Sales |
|---|---|
| Leads generated | Deals closed |
| Campaign sources | Revenue produced |
| Traffic quality | Conversion quality |
| Acquisition cost | Profit margin |
This alignment improves strategic coordination between departments.
Why Excel Still Dominates Many Marketing Teams
Despite the rise of SaaS analytics platforms, Excel continues to offer several advantages:
- flexibility
- affordability
- customization freedom
- offline access
- rapid prototyping
- compatibility with multiple data sources
Many organizations prefer Excel because dashboards can be fully adapted to their internal workflows without requiring expensive software ecosystems.
Advanced Excel Features Frequently Used
Professional marketing dashboards often rely on:
- Pivot Tables
- Power Query
- slicers
- dynamic charts
- INDEX/MATCH formulas
- XLOOKUP
- conditional formatting
- VBA automation
- Power Pivot
These features transform traditional spreadsheets into intelligent analytical systems.
Industries Using Marketing Performance Dashboards
These dashboards are commonly used in:
- digital agencies
- e-commerce businesses
- SaaS companies
- industrial firms
- educational organizations
- consulting firms
- retail businesses
- real estate marketing teams
Every organization seeking measurable growth can benefit from automated marketing reporting.
The Strategic Value of Real-Time Visibility
The real power of a marketing dashboard lies in visibility.
When executives instantly understand:
- which campaigns generate revenue
- where acquisition costs increase
- which channels convert better
- how customer behavior evolves
decision-making becomes significantly faster and more accurate.
A dynamic Excel dashboard therefore acts as both an analytical tool and a strategic accelerator.
Automated Marketing Performance Dashboard in Excel
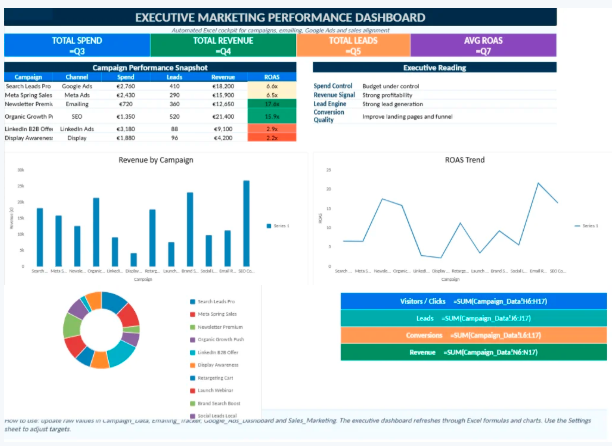
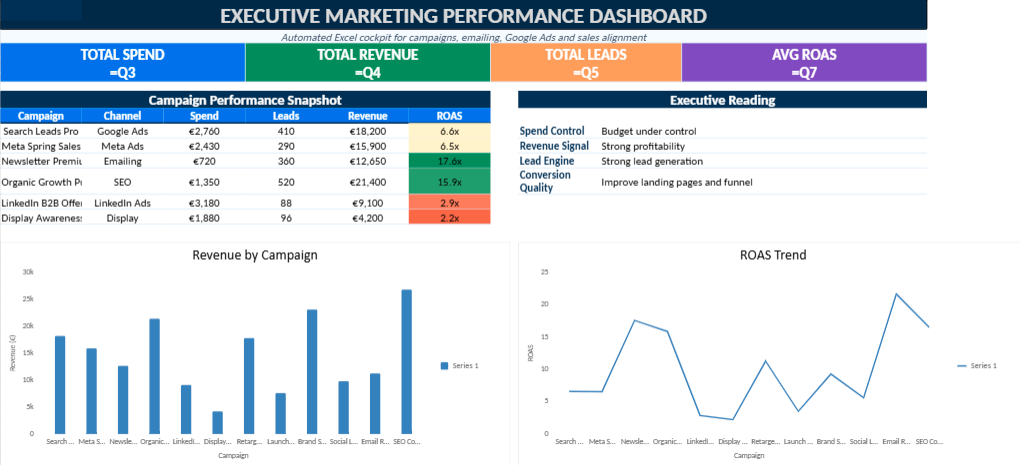
This Excel dashboard is designed to help marketing teams monitor campaign performance, advertising efficiency, email engagement, lead generation and sales impact from a single, visually structured workbook. It combines automated calculations, dynamic performance indicators, clean data tables and executive-level charts to turn raw marketing data into clear business decisions.
Executive Overview
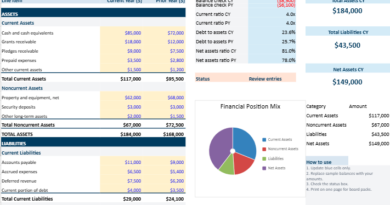
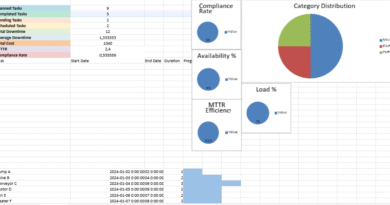
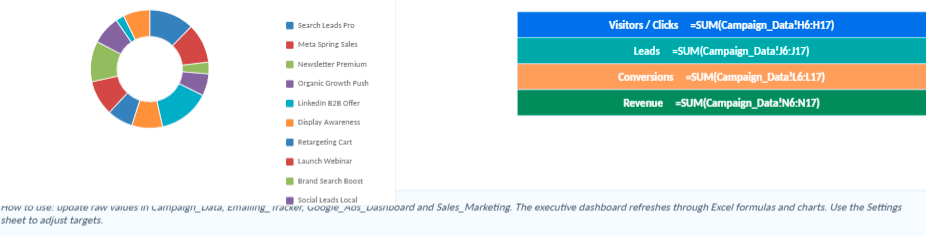
A visual dashboard summarizes total spend, revenue, leads, conversions and ROAS with clear KPI cards and performance charts.
Campaign Tracking
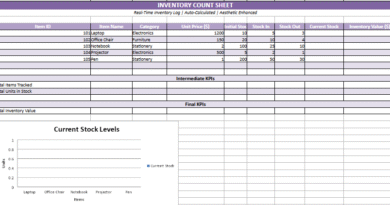
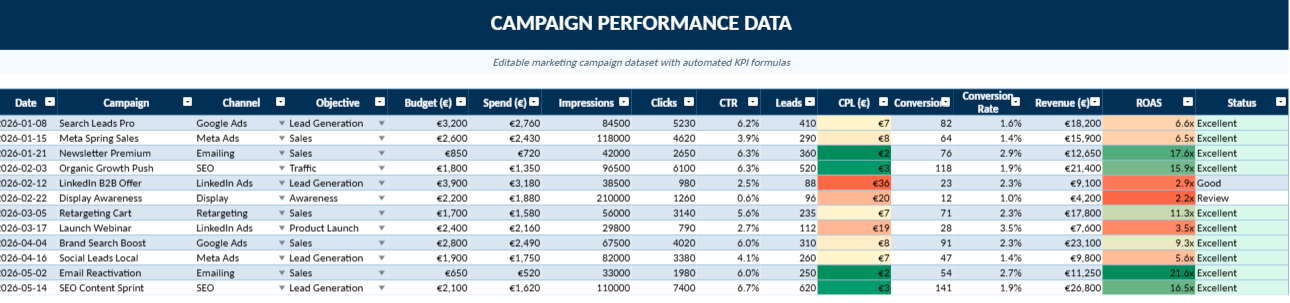
Track each campaign by channel, budget, impressions, clicks, leads, conversions, revenue and profitability status.
Emailing Performance
Monitor email campaigns through open rate, click rate, unsubscribe rate, conversions and revenue per email.
Google Ads Monitoring
Analyze paid search campaigns with CTR, CPC, CPA, conversions, revenue, ROAS and automated decision recommendations.
Sales and Marketing Alignment
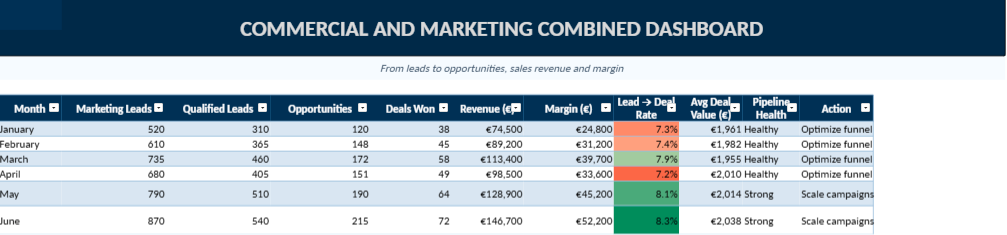
Connect marketing leads to qualified leads, opportunities, won deals, revenue, margin and pipeline health.
Automated Formulas
Built-in formulas calculate CTR, CPL, conversion rate, ROAS, CPA, revenue per email and lead-to-deal performance.
Dashboard Excel automatisé pour mesurer la performance marketing
Ce modèle Excel propose une vue complète et visuelle de la performance marketing. Il centralise les campagnes publicitaires, le suivi emailing, les indicateurs Google Ads et la liaison entre les actions marketing et les résultats commerciaux. Grâce à ses formules automatiques, ses graphiques dynamiques et ses couleurs de lecture, il facilite l’analyse rapide des budgets, des leads, des conversions, du chiffre d’affaires et du ROAS.
Vue exécutive
Une page principale présente les KPI essentiels : dépenses totales, chiffre d’affaires, leads générés, conversions et ROAS moyen.
Suivi des campagnes
L’onglet campagne permet de suivre chaque action marketing par canal, objectif, budget, clics, leads, conversions et rentabilité.
Tracking emailing
Un module dédié mesure les emails envoyés, les ouvertures, les clics, les désabonnements, les conversions et le revenu généré.
Google Ads
Le tableau Google Ads analyse les impressions, clics, CTR, CPC, CPA, conversions, revenus et décisions budgétaires recommandées.
Marketing et commercial
Le fichier relie les leads marketing aux opportunités commerciales, aux ventes conclues, au chiffre d’affaires et à la marge.
Automatisation Excel
Les principaux calculs sont automatisés : CTR, CPL, taux de conversion, ROAS, CPA, revenu par email et lecture de performance.
Appendix — Marketing Dashboard Structure and KPI Definitions
This appendix explains the main components of the automated marketing performance dashboard. It can be used as a reference section for readers who want to understand how the workbook is organized, which indicators are calculated, and how each Excel sheet contributes to marketing analysis and decision-making.
Workbook Sheets
- Executive Dashboard
- Campaign Data
- Emailing Tracker
- Google Ads Dashboard
- Sales and Marketing
- Settings
- How to Use
Automated Calculations
- CTR
- CPL
- CPA
- ROAS
- Conversion Rate
- Revenue per Email
- Lead-to-Deal Rate
Visual Components
- KPI cards
- Revenue charts
- ROAS trend chart
- Spend distribution chart
- Marketing-to-sales funnel
- Conditional formatting heatmaps
| KPI | Formula | Purpose | Business Interpretation |
|---|---|---|---|
| CTR | Clicks / Impressions | Measures the attractiveness of an ad, email or search result. | A higher CTR usually indicates that the message, targeting or creative is relevant. |
| CPL | Marketing Spend / Leads | Measures the average cost required to generate one lead. | A rising CPL may indicate inefficient targeting or weak landing page performance. |
| CPA | Advertising Spend / Conversions | Measures the cost of obtaining one conversion. | Useful for deciding whether a paid campaign should be scaled, paused or redesigned. |
| Conversion Rate | Conversions / Clicks | Measures how effectively traffic turns into measurable actions. | A low conversion rate often points to a weak offer, unclear landing page or poor audience fit. |
| ROAS | Revenue / Advertising Spend | Measures revenue generated for each unit of advertising cost. | A strong ROAS suggests that the campaign is commercially efficient. |
| Revenue per Email | Email Revenue / Emails Sent | Measures the financial value generated by each email sent. | Helpful for comparing promotional, nurturing and reactivation campaigns. |
| Lead-to-Deal Rate | Deals Won / Marketing Leads | Measures the connection between marketing acquisition and sales performance. | A weak rate can reveal poor lead quality or insufficient sales follow-up. |
Appendix — Marketing Performance, KPI Tracking and Excel Dashboard Reference
This appendix provides a generic reference framework for understanding marketing performance measurement in Excel. It connects campaign tracking, digital marketing analytics, paid acquisition, email marketing, sales funnel analysis and business reporting. The objective is to help users interpret a marketing dashboard not only as a spreadsheet, but as a structured decision-making system for monitoring growth, profitability and commercial efficiency.
Marketing Performance
Marketing performance refers to the ability to measure how campaigns contribute to traffic, leads, conversions, revenue and customer acquisition. It helps teams understand which actions create measurable business value.
Excel Dashboard
An Excel dashboard centralizes raw campaign data, automated formulas, KPI cards, visual charts and summary tables. It gives managers a clear view of advertising efficiency, funnel behavior and return on investment.
Campaign Analytics
Campaign analytics compares channels such as Google Ads, Meta Ads, email marketing, SEO, social media and retargeting. It reveals which channels attract qualified visitors and which campaigns require optimization.
Lead Generation
Lead generation tracking measures the number, quality and cost of prospects produced by marketing activities. It connects acquisition campaigns with sales opportunities and future revenue potential.
Paid Acquisition
Paid acquisition analysis focuses on advertising spend, impressions, clicks, CPC, CPA, ROAS and conversion value. It supports budget allocation and helps reduce wasted ad spend.
Sales Funnel
Funnel analysis follows the journey from visitor to lead, from lead to opportunity and from opportunity to customer. It helps identify friction points between marketing and sales teams.
| Semantic Area | Key Terms | Dashboard Role | Business Question Answered |
|---|---|---|---|
| Marketing KPI Tracking | CTR, CPL, CPA, conversion rate, ROAS, ROI, CAC | Transforms raw numbers into measurable performance indicators. | Which campaigns are efficient, profitable and scalable? |
| Advertising Performance | Google Ads, Meta Ads, paid search, display ads, retargeting | Compares paid channels through cost, traffic quality and revenue contribution. | Where should the advertising budget be increased or reduced? |
| Email Marketing Analytics | open rate, click rate, bounce rate, unsubscribe rate, revenue per email | Evaluates engagement, audience quality and financial impact of email campaigns. | Which email campaigns generate real engagement and revenue? |
| Lead Management | marketing qualified lead, sales qualified lead, lead source, lead quality | Links acquisition channels with prospect qualification and sales follow-up. | Are generated leads useful for the sales team? |
| Sales and Marketing Alignment | pipeline, opportunities, deals won, revenue, margin, lead-to-deal rate | Connects marketing efforts with commercial outcomes and revenue generation. | Does marketing activity create measurable sales impact? |
| Executive Reporting | dashboard summary, KPI cards, trend charts, performance alerts | Presents strategic information in a readable format for managers and decision-makers. | What should be scaled, optimized, paused or redesigned? |
| Budget Optimization | marketing spend, campaign budget, cost efficiency, profitability threshold | Highlights budget consumption and compares spending against generated value. | Is the company investing in the right acquisition channels? |