Maintenance KPI Dashboard Excel Template
In today’s fast-paced industrial and facilities management landscape, data-driven decision-making is no longer a luxury—it’s a necessity. Maintenance teams are increasingly expected to optimize equipment uptime, reduce costs, and improve service reliability. At the heart of this operational improvement lies one powerful tool: the maintenance KPI dashboard Excel template.
Whether you’re managing preventive maintenance schedules or tracking technician performance, an Excel-based dashboard provides a practical and accessible way to visualize key metrics and drive action.
Maintenance KPI Excel Template Most people don’t focus on the details of its calculation, preparation, and presentation but at the end of the day, a KPI is a powerful and interactive tool that helps in improving or increasing your project or organization performance. When you add the ability to put preventive maintenance metrics in place, along with technician insight and the ability to receive real-time alerts, will help you take your team from reactive to proactive maintenance.
Whether you’re the plant manager, maintenance manager, or a reliability engineer, getting to grips with KPI tracking in Excel will take your maintenance program to a whole other level. Don’t just gather data — harness it to inform action by choosing the appropriate dashboard.
Why Use a Maintenance KPI Dashboard in Excel?
Excel remains a universal tool in maintenance management due to its flexibility, accessibility, and powerful visualization features. A well-designed maintenance KPI dashboard Excel template allows maintenance managers to:
- Track critical performance indicators (KPIs) in real-time
- Visualize trends in equipment maintenance and technician output
- Monitor preventive maintenance (PM) compliance
- Identify risks before they escalate into costly breakdowns
Moreover, Excel offers integration with external systems and can be customized without the need for specialized software, making it ideal for organizations of all sizes.
Core KPIs Every Maintenance Dashboard Should Include
To create a dashboard maintenance that’s both informative and actionable, it must include relevant KPIs tailored to your operational goals. Below are essential maintenance KPI’s typically featured in a robust dashboard:
- PM Completion Rate (%) – Measures the percentage of scheduled preventive maintenance tasks completed on time.
- Mean Time Between Failures (MTBF) – Indicates equipment reliability by tracking the average operating time between breakdowns.
- Mean Time to Repair (MTTR) – Reflects maintenance responsiveness and repair efficiency.
- Overdue Work Orders – Alerts management to delayed maintenance that could impact operations.
- Technician Utilization Rate – Tracks how effectively technicians are deployed across tasks.
Key Features of an Effective Maintenance KPI Dashboard Excel Template
When designing a maintenance KPI dashboard Excel template, consider incorporating the following features for maximum usability:
1. Data Entry Tab
Include a clean, structured data input sheet for logging work orders, PM tasks, equipment IDs, technician names, scheduled/completed dates, and status indicators.
2. Dynamic KPI Calculations
Use Excel formulas like COUNTIF, AVERAGEIFS, and SUMIFS to automate your calculations. These metrics should update automatically as users input or modify maintenance data.
3. Visual Indicators and Conditional Formatting
Add color-coded alerts (green/yellow/red) and arrow-based icons to quickly interpret performance metrics.
4. Interactive Charts
Embed bar charts, pie charts, and line graphs to compare monthly trends, PM compliance, or technician performance over time.
5. Preventive Maintenance Tracking
A dedicated section to monitor upcoming PMs and highlight overdue tasks ensures nothing falls through the cracks.
How to Create a Dashboard Maintenance That Delivers Results
To create a dashboard maintenance system that works, follow this step-by-step approach:
- Define Your Maintenance Objectives – Are you aiming to improve uptime, reduce reactive maintenance, or optimize labor?
- Gather Historical and Real-Time Data – Start logging data consistently in your Excel template.
- Design KPIs Around Business Goals – Choose metrics that directly impact asset reliability and operational costs.
- Use Excel’s Data Visualization Tools – Turn raw data into meaningful visuals for fast decision-making.
- Review and Iterate Monthly – Use insights to adjust schedules, resources, or equipment investment.
Certainly! Here’s an additional section to extend your article, further enhancing its depth and SEO value while maintaining a professional tone.
Integrating the Maintenance KPI Dashboard with Your Workflow
One of the most powerful aspects of a maintenance KPI dashboard Excel template is its ability to seamlessly integrate with your existing maintenance workflows. By connecting your dashboard to routine operations, it becomes a real-time monitoring tool rather than just a static report.
Automating Preventive Maintenance Scheduling
To keep preventive maintenance consistent and timely, your Excel dashboard should include:
- Conditional alerts for PM tasks due within the next 7 days
- Auto-calculated next PM dates based on maintenance frequency
- Drop-downs for task categorization (e.g., Monthly, Quarterly, Annual)
These features help ensure no preventive task is overlooked and that your maintenance KPI’s reflect actual performance.
Linking to Work Order Systems
While Excel isn’t a full CMMS, it can work alongside one. Many maintenance teams export data from CMMS platforms into Excel for clearer visualization and KPI reporting. This approach keeps your maintenance KPI dashboard Excel template up to date without manual re-entry.
You can even use Power Query or Excel macros to automate data imports and refresh reports with a single click.
Common Mistakes to Avoid When You Create a Dashboard Maintenance System
Despite Excel’s power, many dashboards fall short due to avoidable issues. Here are pitfalls to watch out for:
❌ Tracking Too Many KPIs
Overloading your dashboard with metrics can cause confusion and dilute focus. Stick to key performance indicators that align with your maintenance objectives.
❌ Ignoring Data Quality
Incomplete or inaccurate data entry undermines your dashboard. Implement validation rules, drop-downs, and clearly marked required fields to ensure consistency.
❌ Failing to Act on Insights
A dashboard is only valuable if used to make decisions. Review KPIs regularly with your team, identify trends, and adjust your preventive maintenance plans accordingly.
The Bottom Line
Creating a comprehensive maintenance KPI dashboard Excel template is an investment in operational clarity and efficiency. By tracking the right KPIs, organizing data effectively, and integrating dynamic visuals, you create a powerful tool to support your team and protect your assets.
In a competitive business environment, reactive maintenance is no longer sufficient. With the right dashboard, you shift from fire-fighting to foresight—ensuring every wrench turned and dollar spent contributes to long-term equipment reliability and cost control.
If you’re ready to take control of your maintenance performance, start building your Excel dashboard today—or download a professionally pre-built version to get a head start.
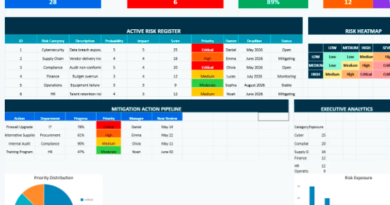
Maintenance KPI Dashboard Excel
🧩 Dashboard Description: If you’re looking for a template that possess a great design, incorporate all the latest features and can be effectively integrated into the most complex business processes then this is the PREMIUM plan for you.
This maintenance KPI dashboard Excel template allows the user to compare a range of metrics used by maintenance management to ensure that all operations are running smoothly, including how often equipment is being used, the time between equipment failure and subsequent repair, the length of time equipment remains in operation after repair, and the total downtime for a piece of equipment.
📁 Workbook Structure
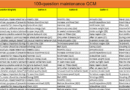
PM Data Entry (Sheet)
This is the master datasheet containing all of the maintenance records. It includes:
- Date of entry
- Asset ID and Equipment Name
- PM Type (via drop down – Monthly, Quarterly, Yearly)
- Assigned Technician
- State of maintenance (planned, carried out, overdue)
- Scheduled and Completed Dates
Key Features:
✅ Dropdowns for easy uniform data entry
✅ Collapsible data table to automatically re-calculate all formulas
✅ Prepopulated sample data for demonstration
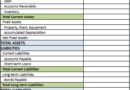
KPI Dashboard (Sheet)
This is a dynamic dashboard that will populate automatically with results:
- Total PMs logged
- Completed PMs
- On-Time Completion %
- Overdue PMs
- Others PMs soon in next 7 days
And, this with more-advanced KPIs such as Average Completion Time and Delayed vs. Early completions.
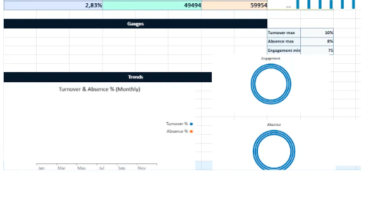
Highlights:
📊 KPI blocks which stand out with colors for better visualization
⬆️ Arrow-based conditional formatting to visualize trends (green = good, red = critical)
- Charts (Sheet)
- Visual comparisons include:
- PM Status Pie Chart (Complete, Scheduled, Overdue)
- Chart showing PMs Schduled vs Done over months on Line Format
- Technician Summary (Sheet)
- This report summarizes:
- Total PMs per tech.
Summary of Completed, Planned, and Past-Due Tasks
Objective: To assess technician performance and distribute workload evenly
✅ How to Use the Dashboard
How to Write Janitorial Services Proposal
Step 1 : Start by Submitting Maintenance Information.
Please click to PM Data Entry sheet and enter your activities.
Try to keep the valid values in PM Type and Status drop-down lists.
Check that due and done dates are actually possible.
Step 2: Monitor KPIs
Simply click on the KPI Dashboard and see the performance. As you add new data, the dashboard will update automatically:
Check the On-Time Completion % for efficiency tracking
Monitor the Upcoming PMs value to prevent overdue tasks
Action Review Overdue PMs for Now
Step 3: Analyze Trends
Visit the Charts tab to:
Monitor your team performance over the period of time (Planned vs Done)
Get a picture of the current status of PMs with a pie chart
Step 4: Assess How Well the Teams Are Performing
Utilize the Technician Summary to:
Find technicians who have too many or too few chores
And where they might need more training or support
by subject (Use of completion reliability as background variable)
🛠 Fixes You can handle the following maintenance scenarios
- Monitor tasks due and past due for PM work across multiple
- assetsMaximize scheduling and dispatch with your technicians
- Visualize maintenance performance to your stakeholders
- Anticipate future workload for proper planning


Maintenance Dashboard Examples
Here are professional descriptions for each of the two dashboards you’ve created and downloaded:
📊 Asset Breakdown Maintenance Dashboard – Description
The Asset Breakdown Maintenance Dashboard provides a clear and visual snapshot of the health and status of your maintenance operations, focused on assets and task priorities. This Excel dashboard is designed for asset managers and maintenance teams who need quick insights into the volume, urgency, and timeliness of work orders.
🔍 Key Features:
- KPI Summary Panel:
- Total Work Orders: Total count of maintenance activities logged
- Completed Orders: Work successfully executed
- Overdue Tasks: High-risk orders not completed on schedule
- High-Priority Tasks: Critical jobs that demand immediate attention
- Data Sheet (Maintenance Data):
- Input sheet for tracking issues per asset, technician, status, and completion details
- Color-coded headers for clarity and structured entry
- Visual Charts (Charts Tab):
- Bar chart: Status breakdown (Completed, Scheduled, Overdue)
- Pie chart: Visual distribution for quick status insights
This dashboard is ideal for identifying maintenance bottlenecks, managing backlog risk, and prioritizing tasks based on urgency.


👷 Technician Performance Maintenance Dashboard – Description
The Technician Performance Maintenance Dashboard evaluates workload distribution and efficiency across your maintenance team. This Excel dashboard is purpose-built for supervisors and maintenance coordinators to assess individual technician contributions and spot performance imbalances.
🔍 Key Features:
- KPI Summary Panel:
- Total Technicians: Count of unique active maintenance staff
- Tasks by Technician: Breakdown of tasks handled by each key team member (e.g., John, Mike, Anna)
- Data Sheet (Maintenance Data):
- Contains technician assignments, task types, and current statuses
- Facilitates easy performance tracking by date and task details
- Visual Charts (Charts Tab):
- Bar chart: Shows comparative task counts per technician
This dashboard helps improve resource allocation, balance team workload, and support performance reviews.