A Refined Approach to Risk Visibility, Strategic Control and Operational Stability
Behind the apparent stability of many organizations, uncertainty constantly circulates in discreet and often invisible ways. A supplier gradually becomes less reliable. A project begins to accumulate delays that initially seem insignificant. Operational costs drift away from forecasts little by little. A technical weakness remains unnoticed until it suddenly interrupts an entire process. Rarely do these situations emerge without warning. Most risks reveal themselves progressively through small signals, subtle imbalances, and recurring irregularities that experienced teams instinctively perceive long before the real consequences appear.
The difficulty does not necessarily come from the absence of information. On the contrary, modern organizations generate enormous amounts of data, reports, observations, and operational feedback every day. The real challenge lies elsewhere. Information remains scattered across departments, fragmented between meetings, emails, spreadsheets, and isolated discussions. What one team considers a minor concern may already represent a significant vulnerability for another. Without a coherent framework capable of organizing these signals clearly, uncertainty slowly transforms into confusion.
This is precisely where a well-structured Risk Matrix Template in Excel reveals its practical value.
Far from being a rigid administrative table designed solely for compliance purposes, the matrix creates a structured vision of organizational exposure. It allows risks to be identified, classified, measured, and monitored with greater clarity. More importantly, it helps organizations distinguish between ordinary operational fluctuations and threats capable of affecting stability, performance, or strategic continuity.
Excel remains particularly appreciated in this domain because of its accessibility and remarkable adaptability. Within a familiar environment, it becomes possible to combine automated calculations, dynamic dashboards, visual heat maps, scoring systems, and mitigation tracking tools capable of supporting both operational supervision and executive decision-making. The objective is not merely to record risks, but to make them understandable, visible, and actionable.
Beyond formulas and visual indicators, the true strength of a risk matrix resides in the managerial discipline it gradually encourages. Discussions become more structured. Priorities emerge more naturally. Responsibilities gain clarity. Teams begin to observe uncertainty with greater lucidity rather than reacting impulsively once problems escalate.
Over time, the matrix evolves into something far more valuable than a simple spreadsheet. It becomes a shared framework for anticipation, coordination, and strategic vigilance in environments where stability can never be taken for granted.
Understanding the Logic Behind a Risk Matrix
At its core, a risk matrix seeks to answer a fundamental managerial question:
Which risks deserve immediate attention, and which ones require routine monitoring?
Without a structured framework, organizations often react emotionally or inconsistently to emerging threats. Minor issues occasionally receive disproportionate attention, while more severe vulnerabilities remain underestimated until consequences become visible.
The matrix introduces rational prioritization.
It evaluates each risk according to two central dimensions:
The probability of occurrence
The severity of impact
The relationship between these two variables determines the level of criticality associated with a particular threat.
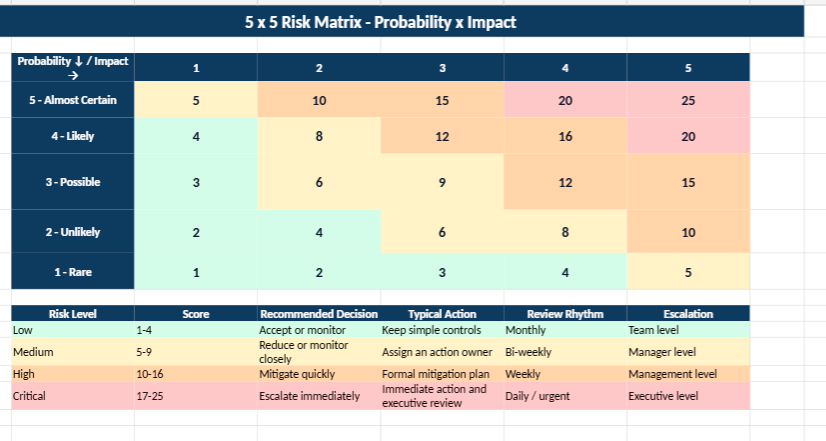
A common structure follows a 5×5 model in which probability and impact are graded progressively from low to severe.
Probability Level
Meaning
1
Rare
2
Unlikely
3
Possible
4
Likely
5
Almost Certain
Impact Level
Meaning
1
Negligible
2
Minor
3
Moderate
4
Major
5
Critical
The overall risk score is generally obtained through multiplication:
Risk\ Score = Probability \times Impact
This seemingly simple logic creates an immediate hierarchy between operational threats.
A highly probable disruption with severe consequences naturally rises to the top of managerial attention.
Why Excel Remains Remarkably Effective for Risk Management
Despite the emergence of specialized governance platforms and enterprise software suites, Excel retains a powerful advantage: adaptability.
Many organizations require tools that are practical, customizable, rapid to deploy, and financially accessible. Excel satisfies these requirements with notable efficiency.
A sophisticated risk matrix in Excel can integrate:
Automated calculations
Dynamic dashboards
Conditional formatting
Interactive charts
Risk heat maps
Corrective action tracking
KPI monitoring
Departmental filtering
Historical evolution analysis
This versatility allows each organization to shape the matrix according to its operational environment rather than forcing teams to adapt to rigid software structures.
An industrial company, for instance, may focus on equipment failures and production interruptions, whereas a financial institution may prioritize liquidity exposure, compliance instability, or fraud-related vulnerabilities.
The framework remains identical; only the nature of the risks changes.
The Strategic Role of the Risk Register
Every effective matrix relies upon a well-structured risk register.
The register serves as the operational memory of the organization’s exposure landscape. It centralizes information that would otherwise remain dispersed across departments or individuals.
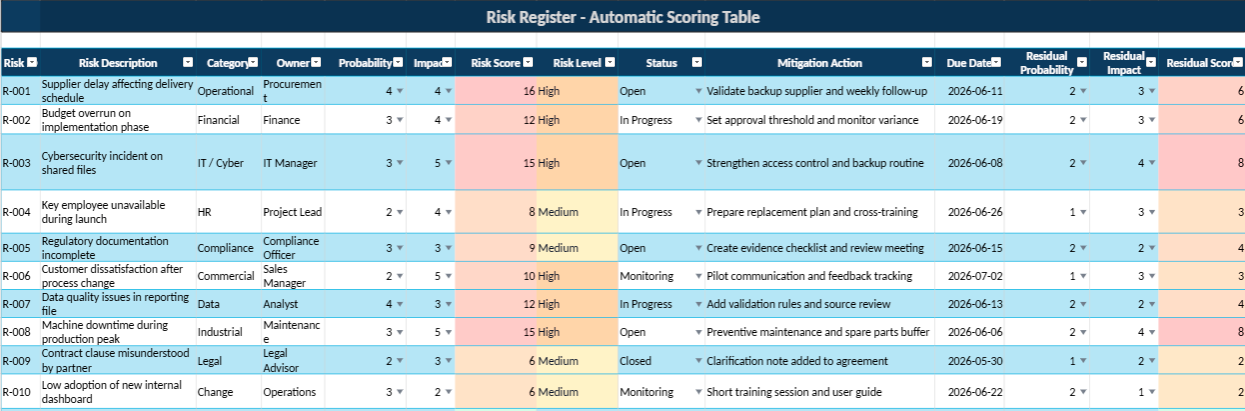
A professional register usually includes:
Field
Purpose
Risk ID
Unique reference number
Risk Description
Detailed explanation of the threat
Category
Financial, operational, strategic, technical
Probability
Likelihood evaluation
Impact
Severity assessment
Risk Score
Automatic criticality result
Owner
Responsible person
Mitigation Action
Planned corrective measure
Status
Open, monitored, closed
This structure introduces accountability into risk management. A risk without ownership often remains unresolved.
Visual Intelligence Through Heat Maps
One of the most compelling aspects of Excel-based risk management lies in visual representation.
Numbers alone rarely produce immediate managerial clarity. Visual hierarchies, however, allow decision-makers to identify critical exposure areas almost instantly.
Conditional formatting transforms the matrix into a dynamic heat map where colors communicate urgency naturally.
Color
Interpretation
Green
Acceptable exposure
Yellow
Moderate vigilance
Orange
Elevated concern
Red
Critical priority
This visual architecture significantly improves executive reporting. Senior management can rapidly identify operational fragilities without reviewing extensive textual reports.
The heat map therefore becomes both an analytical and communicative instrument.
Risk Management as a Tool for Strategic Stability
Many organizations still perceive risk management as a defensive exercise associated exclusively with compliance or auditing requirements. In reality, mature risk management contributes directly to organizational resilience and strategic continuity.
A structured matrix helps organizations:
Anticipate operational disruptions
Reduce financial exposure
Strengthen project control
Improve resource allocation
Protect organizational reputation
Support informed decision-making
In uncertain economic environments, visibility itself becomes a competitive advantage.
Organizations capable of identifying vulnerabilities early often react with greater composure during periods of instability.
Practical Applications Across Industries
The usefulness of a risk matrix extends far beyond one particular sector.
Industrial Operations
Manufacturing environments rely heavily on structured risk evaluation to supervise:
Equipment reliability
Maintenance failures
Workplace safety
Supply interruptions
Production bottlenecks
Project Management
Project teams frequently monitor:
Budget overruns
Delayed milestones
Resource shortages
Scope instability
Contractor dependency
Financial Governance
Financial departments use risk matrices to supervise:
Liquidity pressure
Investment volatility
Currency fluctuations
Fraud exposure
Compliance instability
Information Technology
IT teams classify technological vulnerabilities such as:
Cybersecurity threats
Data leakage
Infrastructure downtime
Unauthorized access
System obsolescence
What Makes a Risk Matrix Truly Professional
A basic spreadsheet may record risks, yet a professional matrix introduces intelligence, structure, and usability.
An effective template generally incorporates:
Feature
Operational Benefit
Drop-down menus
Faster standardized entry
Automated formulas
Reduced calculation errors
Dynamic charts
Improved visibility
KPI indicators
Executive monitoring
Conditional formatting
Immediate prioritization
Dashboard section
Strategic reporting
Filters and slicers
Faster analysis
Data protection
Integrity and reliability
The objective is not complexity. The objective is clarity.
A sophisticated system that teams struggle to use eventually loses operational value.
The Human Dimension of Risk Management
Behind every risk lies a human reality: decisions, assumptions, oversights, delays, pressures, or unforeseen circumstances.
For this reason, risk management should never become a purely mechanical exercise.
The most effective organizations cultivate a culture where teams feel encouraged to report vulnerabilities early rather than conceal them until problems escalate. Transparency, accountability, and anticipation remain central to sustainable operational stability.
The Excel matrix therefore represents more than a technical document. It becomes a shared language through which teams discuss uncertainty with greater precision and discipline.
Common Weaknesses That Reduce Effectiveness
Many risk matrices fail because they become excessively theoretical or disconnected from operational reality.
Several recurring weaknesses appear frequently:
Overcomplicated scoring models
Inconsistent evaluation criteria
Lack of ownership assignment
Static files never updated
Excessive administrative detail
Poor visual readability
Weak integration with decision-making
A useful matrix must remain alive. It should evolve continuously alongside operational realities, projects, and organizational priorities.
A well-designed Risk Matrix Template in Excel offers organizations far more than an organized spreadsheet. It creates a structured environment where uncertainty becomes measurable, priorities become visible, and corrective actions become easier to coordinate.
Its enduring value lies in the balance between simplicity and analytical depth. Through scoring systems, heat maps, dashboards, mitigation tracking, and visual reporting, organizations gain a clearer understanding of their operational exposure and strategic vulnerabilities.
When integrated thoughtfully into daily management practices, the matrix becomes an instrument of foresight rather than a reactive administrative formality. It encourages anticipation, strengthens organizational discipline, and supports more stable decision-making in environments where uncertainty remains unavoidable.
Risk Matrix Template in Excel
This Excel template has been designed to help organizations identify, evaluate, prioritize, and monitor risks with greater clarity. It combines a structured risk register, an automated scoring system, a visual risk matrix, and a management dashboard within a single professional workbook.
The model allows users to classify each risk according to its probability and impact, generate an automatic risk score, and visualize the level of exposure through clear color-coded indicators. It is suitable for project management, operational control, financial supervision, compliance monitoring, quality management, IT governance, and industrial risk assessment.
Main Features
Professional 5×5 risk matrix based on probability and impact
Automated risk scoring system
Structured risk register for detailed tracking
Clear risk levels: Low, Medium, High, and Critical
Visual heat map for quick prioritization
Mitigation action tracking with responsible owners
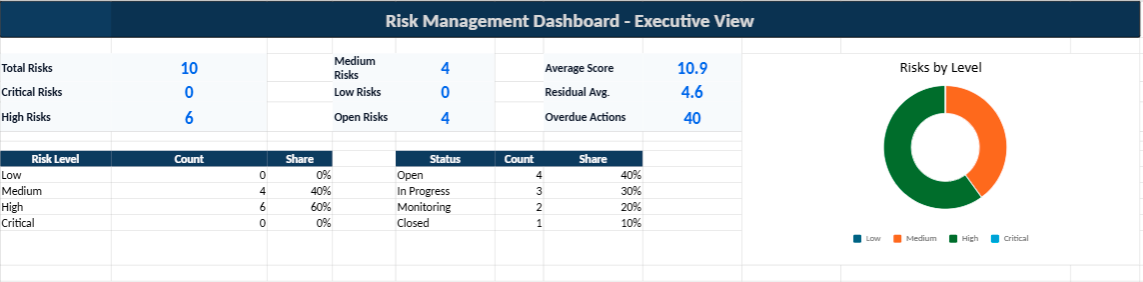
Executive dashboard for management reporting
Color-coded layout for immediate readability
Why Use This Template?
The purpose of this template is not only to record risks, but to make them visible, measurable, and easier to manage. By centralizing risk information in Excel, teams can follow exposure levels, assign responsibilities, monitor mitigation actions, and support decision-making with a more disciplined and transparent approach.
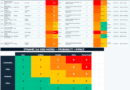
This 5×5 matrix helps classify risks by crossing their probability of occurrence with their potential impact. The higher the score, the stronger the need for control actions, mitigation plans and management follow-up.
Temperature control defines the hidden rhythm of every professional kitchen. Behind refrigerated storage, chilled preparation zones and frozen stockrooms lies
Understanding personal finance becomes considerably more intuitive once financial flows cease to feel abstract or fragmented. Many individuals possess a
The Business Kitchen Safety Checklist transforms daily restaurant supervision into a structured operational routine where hygiene, equipment safety, fire prevention