Nonprofit Accounting Excel Template USA | Dashboard, Reports, Automation
In many nonprofit organizations, the financial side of the work is rarely the part that inspires people first. The mission does. The programs do. The desire to help, educate, support, protect, or serve comes long before anyone gets excited about ledgers, reconciliations, or reporting structures. Yet sooner or later, every nonprofit reaches the same point: good intentions are no longer enough on their own. If the money is not tracked properly, if expenses are recorded inconsistently, or if reports remain unclear, the whole organization starts to feel more fragile than it should.
That is exactly why a Nonprofit Accounting Excel Template can become such a valuable tool, especially in the United States. It gives structure to the financial life of the organization without forcing a small team into expensive software too early. It helps transform scattered entries, isolated files, handwritten notes, and last-minute calculations into one coherent system that is easier to manage, easier to review, and much easier to explain to a board member, donor, grantmaker, or accountant.
For many nonprofits, Excel remains one of the most realistic starting points. It is familiar, flexible, and accessible. When it is designed well, it can do much more than store numbers. It can automate repetitive work, reduce data-entry mistakes, generate real financial statements, and turn raw accounting data into visual dashboards that people can actually understand. That matters, because nonprofit finance is not just about “keeping the books.” It is about showing that the organization is disciplined, transparent, and capable of using its resources wisely.
A strong template creates that bridge between day-to-day bookkeeping and strategic visibility.
Why a Nonprofit Accounting Excel Template Still Makes Sense
Small and medium-sized nonprofits in the United States often operate under real constraints. Budgets are limited. Staff may be small. Sometimes one person handles operations, grants, events, and bookkeeping all at once. In other cases, an executive director relies on a volunteer treasurer or an outside accountant who only reviews the books periodically. Under those conditions, a full accounting platform can feel too costly, too heavy, or simply unnecessary at the beginning.
Excel fills that gap well when the template is thoughtfully built.
It allows an organization to record transactions in a consistent way, organize accounts clearly, and generate reports from a single source of truth. It also gives leadership something many nonprofits badly need: a financial picture that is visible at a glance.
Imagine a local educational nonprofit that runs after-school tutoring in two cities. Donations come from individuals, a small foundation grant covers materials, and a fundraising dinner supports general operations. Without a structured template, the team may know that money came in and money went out, yet still struggle to answer basic questions:
- How much was spent on program activities this quarter?
- How much remains from the grant?
- Are administrative costs increasing?
- Which months create the most cash pressure?
- Are unrestricted funds strong enough to cover upcoming expenses?
A good Excel model makes those answers easier to find. And once those answers become visible, the nonprofit becomes easier to manage.
More Than a Spreadsheet: A Working Financial System
The value of a nonprofit accounting template does not lie in the file itself. It lies in the logic behind it.
A well-designed workbook is not just a list of tabs. It is a practical workflow. Data enters once, then feeds the rest of the system. Transactions posted in the ledger should update totals automatically. Reports should pull from the same entries rather than being rebuilt manually every month. Dashboards should reflect the underlying accounting, not a second disconnected set of numbers.
That structure changes everything.
Instead of rebuilding reports for each board meeting, the organization can refresh and review. Instead of guessing where spending increased, it can identify the category immediately. Instead of scrambling before a grant report or annual review, it can work from records that were already organized properly along the way.
This is where automation and visualization become especially useful.
Automation saves time. Visualization improves understanding.
Together, they make finance less intimidating for teams that are mission-driven but not deeply technical.
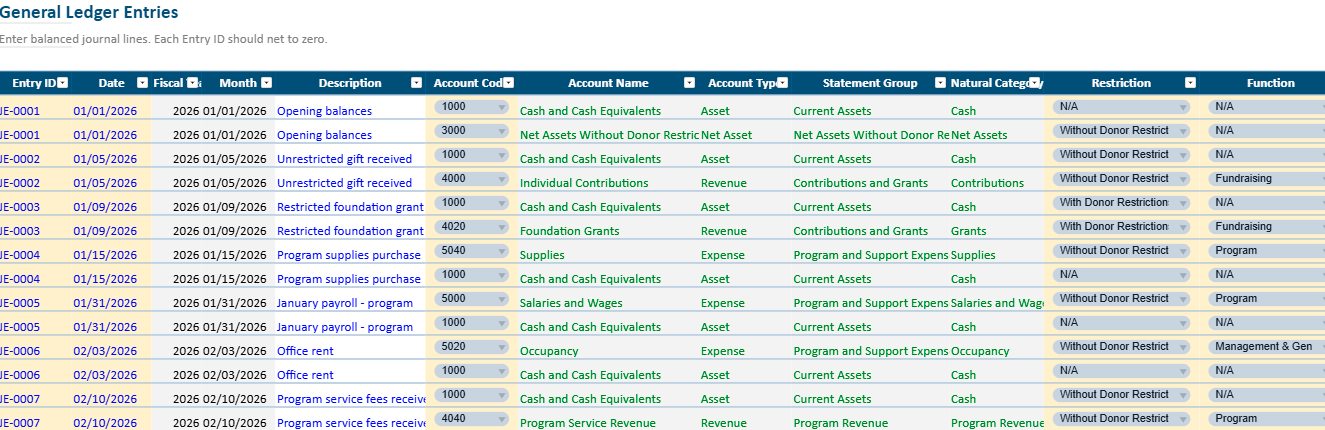
The General Ledger: Where Financial Clarity Begins
At the center of any nonprofit accounting template sits the General Ledger, often called the GL. This is the operating core of the workbook. Every financial event flows through it.
A donation arrives. It is recorded there.
A rent payment goes out. It is recorded there.
A supply purchase for a youth program is made. It is recorded there too.
Each row usually includes essential fields such as:
- date
- description
- reference
- account
- program or fund
- debit
- credit
- optional notes
This may look simple, yet this sheet is where discipline begins. If the ledger is clean, the rest of the workbook can become reliable. If the ledger is inconsistent, every report downstream becomes harder to trust.
For example, imagine a nonprofit animal rescue organization. One week, it records veterinary costs under “program services.” The next week, the same type of expense is entered under “animal care.” Later, someone creates “medical expenses” as a third category. Technically, the spending is there, but the reporting becomes messy because similar transactions are split across inconsistent labels.
A good template prevents that by using dropdowns, standardized account names, and structured categories. That simple design choice reduces confusion and saves enormous cleanup time later.
The Chart of Accounts: Giving the Organization a Financial Language
The Chart of Accounts is the financial vocabulary of the nonprofit. It tells the workbook how to classify each transaction and helps the team speak the same language internally.
For U.S. nonprofits, the structure usually includes five broad areas:
- Assets: cash, bank balances, receivables, prepaid items
- Liabilities: payables, credit card balances, deferred revenue, loans
- Net Assets: with donor restrictions and without donor restrictions
- Revenue: donations, grants, membership dues, event income, service revenue
- Expenses: program services, management and general, fundraising
This structure matters because nonprofit accounting is not identical to for-profit accounting. A business usually focuses on profit. A nonprofit must also show stewardship, restrictions, and functional use of resources.
Take a small arts nonprofit as an example. It may receive:
- $12,000 in unrestricted donations
- a $20,000 grant restricted for workshops
- ticket revenue from a community event
- sponsorship for one annual exhibition
Those are all forms of income, but they do not mean the same thing. Some funds are flexible. Others must be used only for a specific purpose. A strong chart of accounts helps the organization preserve that distinction from the moment the money enters the books.
Without that structure, restricted and unrestricted funds can blur together in ways that create reporting problems later.
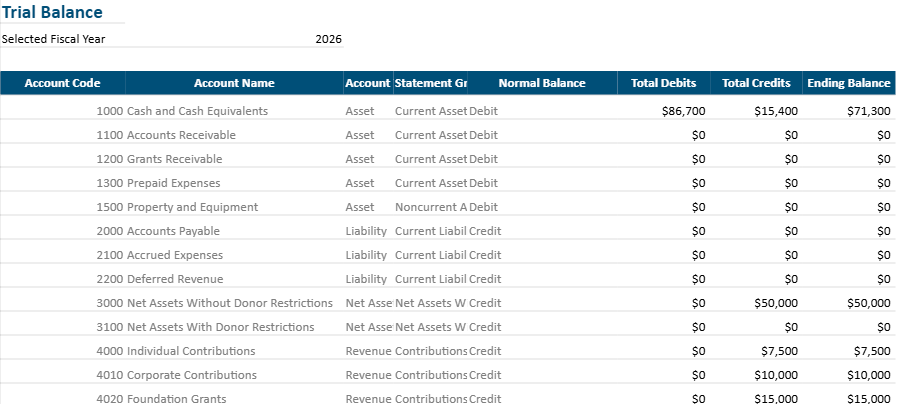
Trial Balance: The Quiet Control That Prevents Bigger Problems
The Trial Balance may not be the most glamorous part of the file, yet it is one of the most important. It gathers totals from all ledger postings and checks whether debits and credits remain in balance.
This is the sheet that quietly tells you whether the accounting still makes sense.
If an entry is incomplete, duplicated, or misclassified, the trial balance often reveals the issue before it spreads further into financial statements. That is why even small nonprofits benefit from reviewing it regularly, especially at month-end.
Picture a community food pantry entering dozens of transactions around a holiday distribution drive: grocery purchases, transport reimbursements, donation receipts, storage fees, volunteer support expenses. In a busy period, one transaction may be posted with the right amount but the wrong side, or an offsetting line may be missed. The trial balance becomes the early warning system that catches that imbalance before the board report is prepared.
In real life, these checks are less about perfection and more about trust. A template that helps teams catch small inconsistencies early prevents stress later.
Statement of Activities: Telling the Story of the Period
For a nonprofit, the Statement of Activities plays a role similar to an income statement in a business, but the spirit behind it is slightly different. It shows what came in, what was spent, and whether the organization ended the period with an increase or decrease in net assets.
This statement answers a simple but essential question:
How did we perform financially during this period?
That question matters far beyond accounting.
If revenue is strong but program delivery is shrinking, leadership needs to understand why. If expenses rise faster than incoming support, the organization may need to adjust. If a year ends with a deficit, that does not always mean failure, but it does require explanation and awareness.
Imagine a nonprofit literacy center. In one year, it receives strong donor support after a successful campaign. At the same time, staffing costs increase because it expands tutoring hours. The Statement of Activities helps leadership explain the full picture: revenue grew, services expanded, costs rose for a reason, and the financial result reflects strategic growth rather than drift.
When the statement is automated inside Excel, that story becomes easier to update throughout the year rather than only once at the end.
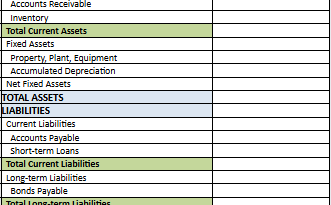
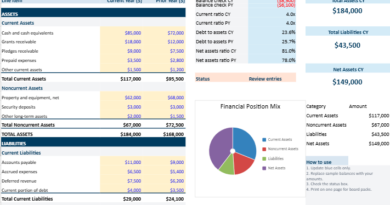
Statement of Financial Position: Seeing Stability, Not Just Movement
If the Statement of Activities tells the story of a period, the Statement of Financial Position shows the organization’s condition at a specific moment.
It answers another crucial question:
What do we have, what do we owe, and what remains?
This includes:
- cash on hand
- receivables
- payables
- obligations
- net assets
For nonprofit leaders, this statement often brings a needed reality check. An organization can look active and successful externally while still being financially tight internally. Events may be full, programs may be visible, and donations may be arriving, yet cash flow could still be fragile if bills are due before funds clear or if restricted money cannot be used for operating needs.
For example, a youth mentoring nonprofit may show $40,000 in total cash, which sounds healthy at first glance. Yet if $25,000 is restricted to a summer program that starts later, and $8,000 is already committed to pending obligations, the true operating flexibility is much smaller than it appears. A strong template helps surface that reality clearly.
That kind of visibility helps leaders make calmer, smarter decisions.
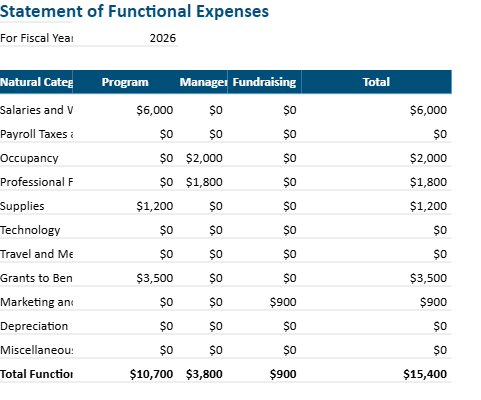
Functional Expenses: One of the Most Important Nonprofit Distinctions
One major difference in U.S. nonprofit accounting is the need to track expenses by function, not only by nature. In other words, the organization should know not just what it spent money on, but also why and in what area of activity.
Expenses are commonly split into:
- Program Services
- Management and General
- Fundraising
This distinction matters for transparency, board oversight, grant reporting, and often annual reporting expectations.
Consider a nonprofit health awareness organization that pays for:
- printing brochures for public education
- internet and office rent
- a fundraising gala venue
- software used by both program staff and administrative staff
Not all these costs belong in the same bucket. Some are program-related, some administrative, and some fundraising. In some cases, a single expense may need a reasonable allocation across categories.
A strong Excel template can make this much easier by linking transactions to functional classifications and summarizing them automatically. That saves time and also reduces the risk of vague end-of-year estimates.
Automation: Why It Changes the Daily Experience of Bookkeeping
In many nonprofits, the problem is not that people refuse to track finances. The problem is that manual tracking becomes tiring and repetitive. Totals are copied from one sheet to another. Reports are rebuilt every month. Formulas break when rows move. One small error turns into a long hunt across tabs.
Automation reduces that friction.
When a template is built properly, one transaction entry can feed multiple outputs automatically:
- the ledger updates
- account totals refresh
- the trial balance changes
- financial statements update
- the dashboard reflects the new numbers
That means less duplication, fewer manual edits, and a lower chance of inconsistency.
Suppose a nonprofit enters a $5,000 grant deposit tagged as restricted program revenue. A strong workbook can instantly reflect that in the correct revenue line, update the restricted net assets logic, and display the change in a revenue chart without any extra manual report building.
This does not just save time. It makes the financial system feel less fragile.
And when the system feels less fragile, people actually use it more consistently.
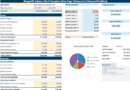
Visualization: Because People Need to See the Story, Not Just Read the Numbers
Not everyone on a nonprofit team is comfortable reading raw financial statements. Board members, program coordinators, and donors often need a more immediate way to understand the financial picture.
This is where visualization becomes powerful.
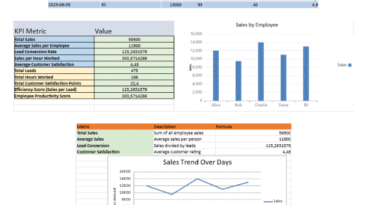
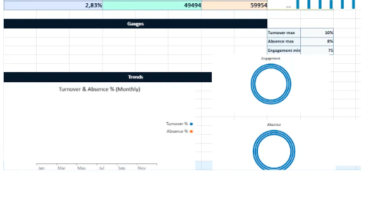
A dashboard can turn accounting data into charts, summaries, and indicators that make the situation easier to grasp. For example:
- monthly revenue vs. expenses
- expense breakdown by function
- grant income by source
- cash trend over time
- top spending categories
- budget vs. actual comparisons
These visuals do more than make the workbook look modern. They help the team spot patterns.
A board treasurer may notice that fundraising costs spike every autumn. An executive director may see that unrestricted revenue is weakening even though total income looks stable. A program manager may realize that one initiative uses more resources than expected relative to participation levels.
Those insights often emerge faster in a chart than in a dense table.
Visualization gives financial data a practical voice.
Real Examples of How a Nonprofit Might Use the Template
Example 1: Small Community Center
A neighborhood community center runs workshops, youth support sessions, and cultural events. It has one paid coordinator, a volunteer treasurer, and mixed funding from donations, municipal support, and event income.
Using the Excel template, the center records each transaction in the GL, tags expenses by program, and produces a simple dashboard for quarterly board meetings. Before adopting the template, the treasurer spent several hours each month consolidating information from different files. After adoption, the board receives clearer reports with less last-minute stress.
Example 2: Faith-Based Outreach Program
A small outreach organization distributes food and hygiene kits, supported mainly by individual donors. Its challenge is not complexity, but consistency. Donations are frequent, expenses are numerous, and recordkeeping has historically been informal.
With an automated template, the team standardizes categories, tracks monthly giving trends, and compares distribution expenses against operating support. It becomes easier to show donors how contributions were used, which strengthens confidence and recurring support.
Example 3: Education Nonprofit Preparing for Growth
An education nonprofit begins with one tutoring program, then expands into scholarship support and mentoring. As activity grows, leadership needs to separate restricted scholarship donations from general operations and allocate expenses more accurately.
The workbook helps them do that before moving to a larger accounting system. In effect, Excel becomes a bridge between startup informality and mature financial structure.
A Helpful Tool for Boards, Grant Reports, and Internal Decisions
One of the overlooked strengths of a good accounting template is that it serves multiple audiences at once.
For internal staff, it improves organization.
For board members, it improves visibility.
For donors, it supports transparency.
For grantmakers, it makes reporting easier.
For accountants, it creates cleaner records to review.
That flexibility matters. A nonprofit often has to explain the same financial reality in different ways to different people. A program team may want to know whether an initiative stayed on budget. A donor may want to know how funds were used. A board member may want to review the ratio between program activity and overhead. A CPA may want properly categorized transactions before year-end work begins.
A solid Excel template makes all those conversations easier because the data has already been organized with care.
Best Practices That Make the Template Work Better Over Time
Even the best file cannot create discipline on its own. The workbook becomes valuable when the organization uses it consistently.
A few habits make a major difference:
Record transactions regularly rather than waiting until the end of the month. Delayed entry creates backlog and weakens accuracy.
Use clear descriptions. “Office expense” is far less helpful than “printer toner for admin office” or “bus rental for youth field trip.”
Review the ledger and trial balance monthly. Small checks prevent large cleanups.
Avoid inventing new categories too often. Keep the chart of accounts stable unless there is a real reporting reason to expand it.
Protect formula cells where possible so that input areas remain separate from reporting logic.
Keep backup copies in a secure place, especially if more than one person accesses the file.
These practices sound simple because they are simple. And in accounting, simple habits often create the strongest systems.
When Excel Is the Right Choice and When It May No Longer Be Enough
Excel is powerful, yet it also has limits. For many nonprofits, it is exactly the right solution in the early and middle stages. It works particularly well when transaction volume is moderate, teams are small, and the priority is affordability plus visibility.
Over time, though, some organizations outgrow it.
That usually happens when:
- transaction volume becomes very high
- multiple users need simultaneous access
- approval workflows become more complex
- integrations with payroll, donor databases, or banks become essential
- audit and compliance needs become more advanced
Even then, starting with a strong Excel template is not wasted effort. In many cases, it teaches the organization how to structure its accounts, classify its activities, and understand its reporting needs before migrating to a larger system.
In other words, Excel often helps nonprofits become ready for the next step.
Why This Kind of Template Solves a Real Problem
The real problem many nonprofits face is not simply “we need a spreadsheet.” The deeper issue is this: they need a financial tool that is clear enough for non-specialists, structured enough for accountability, and practical enough for everyday use.
That is what makes an automated and visual nonprofit accounting Excel template genuinely useful.
It helps a founder stop guessing.
It helps a treasurer stop rebuilding reports by hand.
It helps a board stop looking at scattered numbers without context.
It helps an organization present itself with greater seriousness.
And that seriousness matters. Not because nonprofits should become cold or corporate, but because financial clarity protects the mission. It protects trust. It protects the ability to keep serving people well.
Nonprofit Accounting Excel Template for USA
This Excel template helps U.S. nonprofits record transactions, organize accounts, automate core reports, and visualize financial performance in one place.
How to use it
- Set your fiscal year in the Setup sheet.
- Review the Chart of Accounts and adjust account names if needed.
- Enter transactions in the General Ledger sheet using the dropdown fields.
- Check the Trial Balance to confirm that entries stay balanced.
- Review the financial statements to see your Statement of Activities and Statement of Financial Position update automatically.
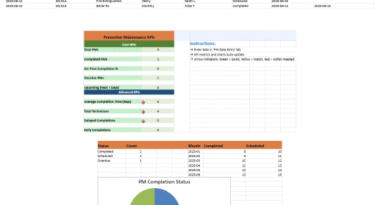
- Use the Dashboard to monitor revenue, expenses, cash position, and major trends visually.
- Track functional expenses to separate program, administrative, and fundraising costs more clearly.