In practice, financial decisions rarely depend on a single number. Yet, when leasing is discussed, attention often converges almost instinctively on the monthly payment. This figure, because it is immediate and tangible, creates a sense of clarity. However, such clarity is often partial.
Indeed, leasing is not defined solely by what is paid each month, but rather by how these payments unfold, accumulate, and ultimately reshape the overall cost of the asset over time. Consequently, without a structured approach, the decision risks being guided more by perception than by analysis.
Beyond the monthly payment: a broader financial perspective
At first glance, leasing appears to offer a reassuring framework. Payments are spread over time, the initial investment is limited, and the acquisition process becomes more accessible. For many organisations, particularly those seeking to preserve liquidity, this structure seems both practical and efficient.
Nevertheless, this apparent simplicity conceals a more complex reality. A leasing contract integrates multiple dimensions simultaneously: the duration of the agreement, the level of periodic payments, the existence of a residual value, as well as additional costs such as fees or deposits. More importantly, it embeds an implicit financing cost that is not always explicitly stated.
Therefore, focusing exclusively on the monthly payment inevitably leads to an incomplete understanding.
The importance of reconstructing cash flows
In this context, an Excel cash flow model plays a decisive role. Rather than isolating figures, it reconstructs a financial sequence. Each payment is positioned in time, each cost is integrated into a broader structure, and the cumulative effect becomes visible.
More precisely, the model enables a progressive reading of the financing:
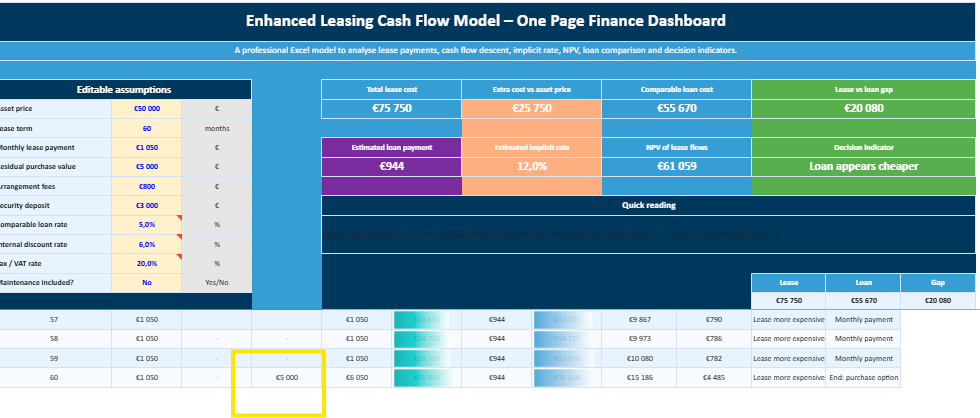
initially, the impact of fees and deposits
subsequently, the regularity of monthly payments
finally, the effect of the residual value at the end of the contract
As a result, the financing is no longer perceived as a static arrangement, but as a dynamic process evolving over several years.
A concrete illustration of cost evolution
To better grasp this mechanism, consider a common scenario.
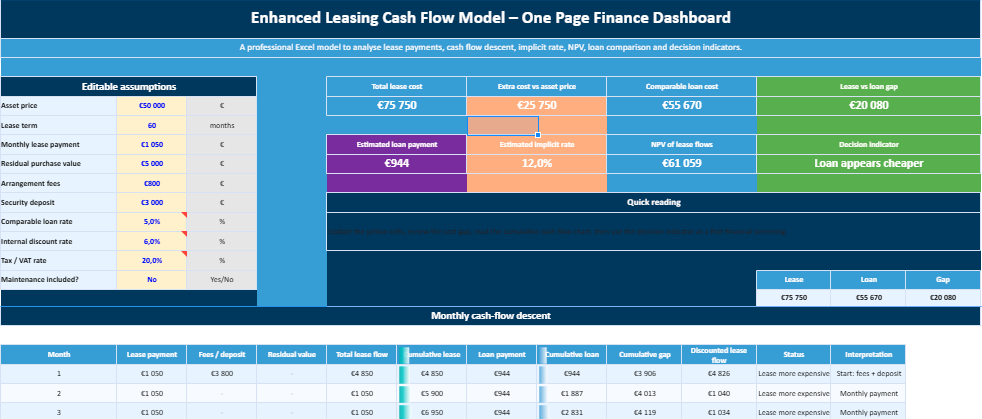
A company intends to finance an asset valued at €50,000.
On the one hand, a leasing solution is proposed with a monthly payment of €1,050 over 60 months, combined with a final residual value of €5,000. On the other hand, a traditional bank loan is available at an annual rate of 5%, leading to a monthly repayment of approximately €943 over the same period.
At first sight, the difference between €1,050 and €943 may appear moderate. However, once the full financial trajectory is reconstructed, the divergence becomes more pronounced.
Indeed, the leasing option leads to a total outflow of €68,000, whereas the loan results in approximately €56,580. Consequently, the gap exceeds €11,000, a difference that is not immediately apparent without a structured analysis.
Understanding the logic behind the difference
This discrepancy is not accidental. It reflects the fundamental nature of leasing as a financing mechanism.
Unlike a loan, where the interest rate is explicitly stated and easily identifiable, leasing incorporates its cost within the payment structure. In other words, the financial charge is present, yet less visible.
Hence, the concept of an implicit rate becomes essential. By applying financial functions within Excel, such as RATE, it becomes possible to estimate this hidden cost. In doing so, the analysis shifts from a superficial comparison to a more rigorous evaluation of financing conditions.
However, cost alone does not determine the decision
Despite the financial advantage of the loan in the example above, it would be reductive to conclude that leasing should systematically be avoided. In reality, financial decisions are rarely based on a single criterion.
On the contrary, several contextual factors intervene:
the need to preserve cash flow in the short term
the desire to maintain financial flexibility
operational considerations related to asset renewal
accounting or tax treatment specific to the organisation
Thus, leasing may remain relevant, even when its nominal cost appears higher. What matters, ultimately, is the alignment between the financing structure and the company’s broader strategy.
The added value of Excel as a decision tool
In this regard, Excel should not be viewed merely as a calculation environment, but rather as a framework for reasoning. By structuring data coherently, it allows decision-makers to test hypotheses, compare scenarios, and anticipate consequences.
For instance, adjusting the duration of the contract or modifying the monthly payment immediately reveals the sensitivity of the total cost. Similarly, integrating a discount rate enables the calculation of net present value, thereby introducing a temporal dimension to the analysis.
Consequently, Excel transforms isolated data into a coherent financial narrative.
The role of cumulative cash flow
Among the various outputs of such a model, cumulative cash flow deserves particular attention. While individual payments provide local information, cumulative figures reveal the global impact.
Over time, even moderate differences in monthly payments can lead to substantial divergences. Therefore, observing how costs accumulate month after month offers a more realistic perception of the financial burden.
Furthermore, when this information is represented graphically, the interpretation becomes even more intuitive. A curve illustrating cumulative cash flow makes it possible to identify trends, inflection points, and long-term disparities with greater clarity.
Integrating scenario analysis
Beyond static evaluation, a robust model also incorporates scenario analysis. By varying key parameters—such as the payment amount, the contract duration, or the residual value—it becomes possible to assess the robustness of the decision.
This approach highlights the sensitivity of the financing structure. In some cases, a slight variation may have a limited impact. In others, it may significantly alter the outcome.
Therefore, scenario analysis contributes to a more resilient decision-making process.
From intuition to structured judgement
It is important to acknowledge that many financial decisions are initially guided by intuition. Experience, familiarity, and operational constraints all play a role.
However, intuition alone may overlook certain dynamics, particularly those related to time and accumulation. By contrast, a structured model complements intuition by introducing measurable elements.
It does not replace judgement; rather, it refines it.
A more comprehensive approach to financing
Ultimately, evaluating a leasing option requires a broader perspective. Cost, flexibility, risk, and strategic alignment must all be considered simultaneously.
In this respect, the Excel cash flow model does not simplify the decision. Instead, it enriches it by providing a more complete understanding of the underlying mechanisms.
Excel Finance Model
Leasing Cash Flow Model in Excel
This Excel model helps you understand the real cost of a leasing decision by showing how payments, fees, residual value and cumulative cash flows evolve over time. Instead of looking only at the monthly payment, the spreadsheet turns the entire financing structure into a clear, readable timeline.
Main purpose
Compare leasing vs loan
Cash flow • NPV • Implicit rate
Structured assumptions
Users can adjust asset price, lease term, monthly payment, residual value, fees, deposit and discount rate.
Cash flow descent
The model tracks each monthly outflow and shows how the total financial commitment builds up over time.
Loan comparison
A built-in comparison highlights whether leasing appears more expensive or more competitive than a bank loan.
Why this model is useful
Leasing can look simple when the decision is reduced to a monthly payment. In reality, the full cost depends on the duration of the contract, the final purchase option, initial charges and the implicit financing rate hidden inside the offer. This model makes those elements visible.
It supports a more realistic financial decision by combining monthly cash flow analysis, cumulative cost tracking, NPV calculation, implicit rate estimation and scenario testing in a single Excel workbook.
Strategic marketing rarely rewards improvisation for long. Behind every successful campaign lies a structured understanding of positioning, customer behaviour, segmentation,
Precision rarely fails loudly at the beginning. Industrial controllers, probes and calibration instruments usually continue operating while small deviations quietly