Preventive Maintenance KPI Dashboard in Excel
In the operational heartbeat of any asset-intensive organization, preventive maintenance remains a cornerstone of longevity, performance, and reliability. But maintenance alone is no longer sufficient—it must be measurable, strategic, and responsive. This is where the Preventive Maintenance KPI Dashboard in Excel emerges not just as a tool, but as a framework for actionable insight.
🧩Maintenance préventive
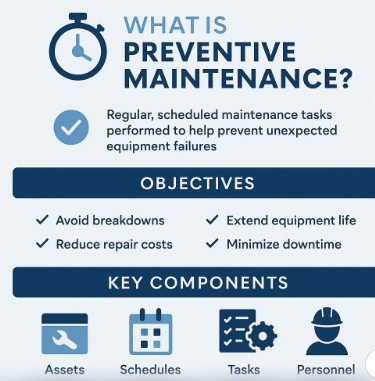
I. Definition
Preventive Maintenance (PM) is a proactive maintenance strategy aimed at preventing equipment failure before it occurs, by performing regular, scheduled tasks based on time, usage, or condition.
II. Objectives
- 🛡 Avoid unexpected breakdowns
- 🧰 Extend equipment lifespan
- 💰 Reduce emergency repair costs
- 📈 Optimize performance and safety
- ⏱ Minimize production downtime
III. Key Components
1. Assets
- Machines, vehicles, facilities, tools, etc.
2. Schedules
- Time-based: e.g. every 30 days
- Usage-based: e.g. every 100 operating hours
- Condition-based: e.g. vibration or temperature thresholds
3. Tasks
- Lubrication
- Inspections
- Calibration
- Cleaning
- Part replacement
4. Personnel
- Technicians
- Maintenance supervisors
- Reliability engineers
IV. Execution Flow
Asset Registry → Maintenance Plan → Task Scheduling → Task Execution → Reporting → Feedback Loop
V. Types of Preventive Maintenance
- Routine Maintenance (regularly scheduled)
- Predictive Maintenance (based on sensor data and condition monitoring)
- Planned Maintenance (coordinated with production schedules)
VI. KPIs to Monitor PM Effectiveness
- ✔ Number of Planned vs. Completed Tasks
- ⏱ Mean Time to Repair (MTTR)
- 📊 Compliance Rate (%)
- 🛑 Unplanned Downtime Hours
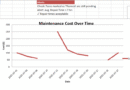
- 💸 Maintenance Cost per Asset
VII. Benefits
- ✅ Increases asset reliability
- ✅ Prevents costly downtime
- ✅ Improves operational safety
- ✅ Enables better budgeting and resource allocation
Why KPIs Matter in Preventive Maintenance
KPIs—Key Performance Indicators—are more than just metrics. They are navigational instruments guiding maintenance managers toward optimal performance. When curated properly, KPIs reflect equipment health, team efficiency, cost-effectiveness, and system availability. The abstraction behind a KPI? It condenses raw activity into a meaningful judgment: is the system running as intended, and are we prepared for what’s next?
🧰 From Raw Data to Dynamic Dashboard
Our Excel dashboard template is a sophisticated yet intuitive design, created with a combination of automated formulas, interactive charts, and color-coded intelligence. Its modular design serves multiple industries—from manufacturing and logistics to utilities and production.
Key Features of the Dashboard:
- Automated KPI Calculations for:
- Planned vs. Completed Maintenance Tasks
- MTTR (Mean Time to Repair)
- Compliance Rate
- Load and Availability
- Total Cost and Downtime
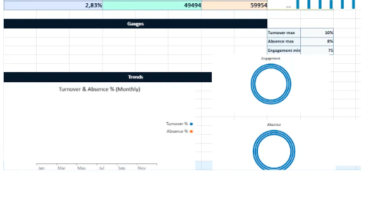
- Radial KPI Visuals:
- Semi-circular pie charts for quick-glance performance
- Distinct colors per metric to enhance cognitive recognition
- Integrated Gantt Timeline:
- Progress bars embedded directly in the dashboard sheet
- Each bar dynamically colored to indicate task duration
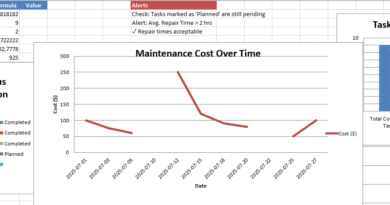
- Conditional Alerts:
- Red, Yellow, Green highlighting for performance thresholds
- Slicer-Ready Tables:
- Instant filtering by asset, technician, category, or status
📊 The Visualization Strategy
Design is not decoration—it’s function. The dashboard orchestrates visuals to maximize information efficiency:
- Color-coded bars deliver at-a-glance urgency.
- Radial charts create familiarity with performance dials.
- Gantt timelines contextualize task duration and scheduling gaps.
- Highlight logic flags areas needing attention—like low compliance or high MTTR.
🖥 How to Use the Dashboard
- Enter Maintenance Events: Fill in asset data, planned and completion dates, technician, and downtime.
- View KPI Block: The dashboard automatically updates to reflect your inputs.
- Analyze Gantt Progress: Visual Gantt bars adjust to match durations and reveal planning bottlenecks.
- Interact via Slicers: In Excel, use slicers to filter and analyze by department or asset type.
- Print or Export: The layout is ready for PDF generation or boardroom presentation.
📈 Beyond Monitoring: Strategic Maintenance
The real strength of this dashboard isn’t just real-time monitoring—it’s long-term strategy. By comparing MTTR trends, examining compliance slumps, and assessing technician efficiency, managers can forecast risks, allocate resources better, and justify investments.
In the era of lean maintenance and predictive reliability, Excel remains a champion of practical ingenuity—when wielded correctly. This Preventive Maintenance KPI Dashboard is more than a spreadsheet: it’s an operational compass that speaks with clarity, visual weight, and strategic context. For engineers, plant managers, and operations executives, this dashboard simplifies what matters—and that is the essence of excellence.
🔧 Breakdown of a Preventive Maintenance Dashboard (Excel-Based)
Here’s a breakdown of a Preventive Maintenance Dashboard—using the advanced Excel template we’ve developed—as both a guide and practical reference. Each component plays a role in turning raw maintenance data into meaningful insights:
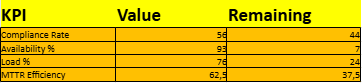
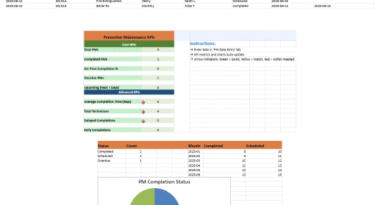
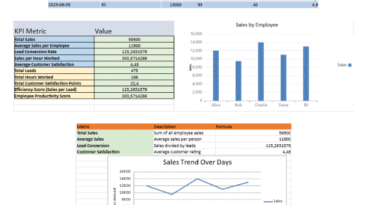
1. 🎯 KPI Performance Section
This is the heart of the dashboard, summarizing key metrics that reflect maintenance efficiency and equipment readiness.
| KPI | Meaning | Formula Logic Example |
|---|---|---|
| Planned Tasks | Total number of tasks scheduled in a given period | =COUNTA(B2:B1000) |
| Completed Tasks | Tasks marked as completed | =COUNTIF(H2:H1000, "Completed") |
| Pending Tasks | Open or delayed tasks not yet completed | =COUNTIF(H2:H1000, "Pending") |
| Scheduled Tasks | Work that’s been planned but not yet due | =COUNTIF(H2:H1000, "Scheduled") |
| Compliance Rate (%) | % of completed over planned tasks | =Completed / Planned |
| MTTR (hrs) | Average time to repair completed tasks | =Total Downtime / Completed |
| Load % | Resource utilization (based on scheduled tasks vs capacity) | Custom or defined manually |
| Availability % | % of time asset is available and functional | Optional: =Uptime / Total Time |
| Total Cost | Sum of repair or maintenance costs | =SUM(J2:J1000) |
| Downtime (Total) | Hours lost due to asset unavailability | =SUM(I2:I1000) |
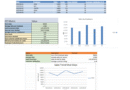
2. 📊 Visual Representations
These turn numbers into patterns, enabling faster decisions:
✅ Radial KPI Charts
- Semi-circular graphs display each KPI’s performance percentage (e.g., 80% Compliance Rate).
- Color-coded (Green for healthy, Yellow for caution, Red for concern).
✅ Bar and Pie Charts
- Bar chart for task counts by status or department.
- Pie chart showing task distribution by category (Mechanical, Electrical, etc.).
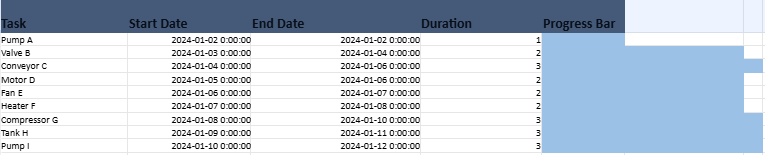
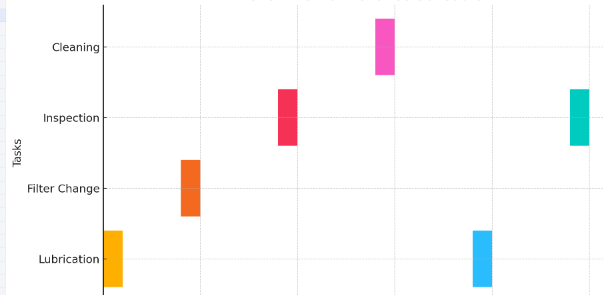
✅ Gantt Timeline
- Embedded below KPIs.
- Shows task durations visually as horizontal bars.
- Each task is color-coded by type or urgency.
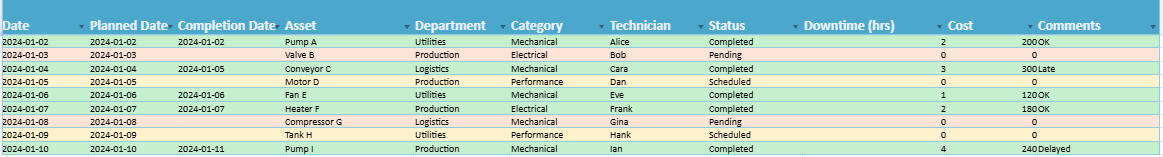
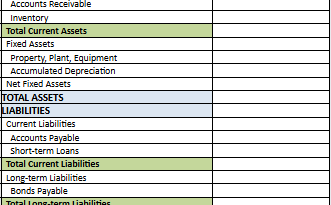
3. 📋 Data Entry Sheet
Structured for consistency and ready for slicer integration. Fields include:
Date,Planned Date,Completion DateAsset,Department,CategoryTechnician,Status,Downtime (hrs),Cost,Notes
A table structure (MaintenanceTable) ensures easy filtering and dynamic updates.
4. 🎛 Conditional Alerts
Used to flag performance thresholds:
- Compliance Rate < 80% → Red
- MTTR > 3 hours → Red
- MTTR between 1–3 → Yellow
- MTTR < 1 hour → Green
These visual cues immediately highlight operational risks.
5. 🔍 Interactive Slicers
Though not natively usable in Python or openpyxl, slicers are ready in Excel for:
- Department
- Technician
- Category
- Status
Once slicers are inserted in Excel, users can filter the entire dashboard interactively.
📦 How It All Connects
- Data Entry → Feeds all metrics via formulas.
- KPI Panel → Automatically updates.
- Charts → Mirror the KPI values and trends.
- Gantt Timeline → Shows upcoming, ongoing, and completed tasks visually.
- Conditional Formatting → Highlights critical areas needing attention.
- Summary Sheet or Export → Ideal for reporting or presentations.
🧾 Maintenance KPI Calculator
The file is a fully functional and visually structured Preventive Maintenance KPI Dashboard Template. Here’s a breakdown of its contents and features:
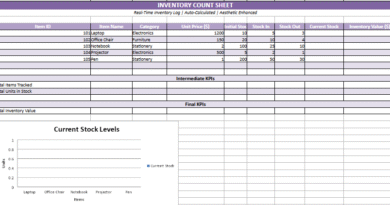
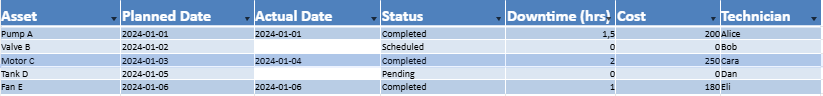
📁 1. Data Entry Sheet
- Purpose: Central repository for maintenance logs
- Fields Included:
- Asset
- Planned Date
- Actual Date
- Status (Completed, Pending, Scheduled)
- Downtime (hrs)
- Cost
- Technician
- ✅ Slicer-Ready Table: Formatted as an Excel table (
MaintenanceTable) for interactive filtering
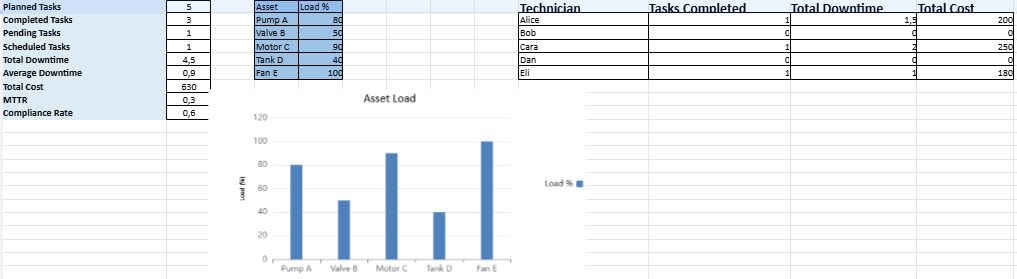
📊 2. KPI Calculator Sheet
A real-time performance monitoring panel powered by dynamic Excel formulas.
🧮 Automated KPIs:
- Planned Tasks
- Completed Tasks
- Pending/Scheduled Tasks
- Total & Average Downtime
- Total Cost
- MTTR (Mean Time to Repair)
- Compliance Rate
📉 Visual Elements:
- Load Bar Chart: Shows % workload across different assets
- Color-coded cells for ease of reading and interpretation
👷 3. Technician Scorecard Section
Tracks individual technician performance:
| Technician | Tasks Completed | Total Downtime | Total Cost |
|---|---|---|---|
| Alice | ✅ | ✅ | ✅ |
| … | … | … | … |
- Fully automated via
COUNTIFSandSUMIFS - Extendable by adding more names
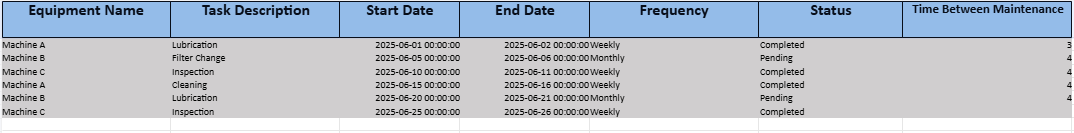
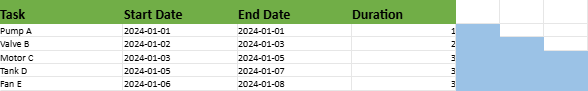
📅 4. Schedule Gantt Sheet
- Simulated Gantt chart using colored cells
- Displays start date, end date, and auto-calculated task durations
- Each task visualized with a horizontal colored bar
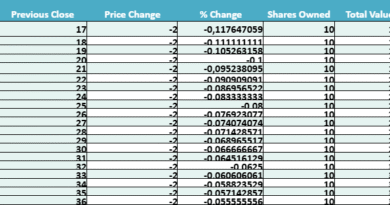
🔮 5. Forecast Sheet
Provides simple predictive maintenance modeling:
| Week | Projected Cost | Projected Downtime |
|---|---|---|
| Week 1 | $225 | 4 hrs |
| Week 2 | $250 | 4.5 hrs |
| … | … | … |
- Ideal for trend estimation and budget projection
🎁 Key Features Summary
- ✅ Fully automated KPI calculations
- 🎨 Bar and Gantt-style visualizations
- 🧮 Scorecard for human performance tracking
- 🧠 Simple forecasting for strategic planning
- 🔄 Ready for slicer-based interactivity
- 🖨️ Clean layout, suitable for printing or boardroom review
🔧 Preventive Maintenance KPI Dashboard Excel with Gantt Visuals
This advanced Excel dashboard is a fully automated, interactive, and visually enhanced tool designed for maintenance performance monitoring. It provides operational insights through smart visual elements, strategic layout, and real-time calculation of essential KPIs.
🧩 Key Features
- ✅ Automated KPI Calculations:
- Planned vs Completed Tasks
- Compliance & Non-Compliance Rates
- Mean Time To Repair (MTTR)
- Total Downtime & Cost
- Load and Availability Metrics
- 📊 Visualized KPI Indicators:
- Distinct radial progress charts next to each KPI
- Fully synchronized with live data inputs
- Colored according to thresholds (e.g., red for low compliance)
- 📅 Integrated Gantt Timeline:
- Real progress bars embedded within the Dashboard sheet
- Shows actual durations and task statuses
- Color-coded for intuitive reading
- 📋 Smart Data Entry Module:
- Centralized, structured form for logging all maintenance events
- Ready for slicer-based filtering (Technician, Department, Category)
- 🖥 Executive Summary Design:
- Titles, layout, and spacing crafted for presentation or reporting
- Conditional formatting highlights performance anomalies
- Print-ready and exportable for meetings or audits
💼 Use Case Scenarios
- Facility and Maintenance Managers seeking operational clarity
- Engineering departments needing downtime tracking
- Organizations aiming to comply with planned maintenance targets
- Any team seeking a scalable, readable maintenance tracking system