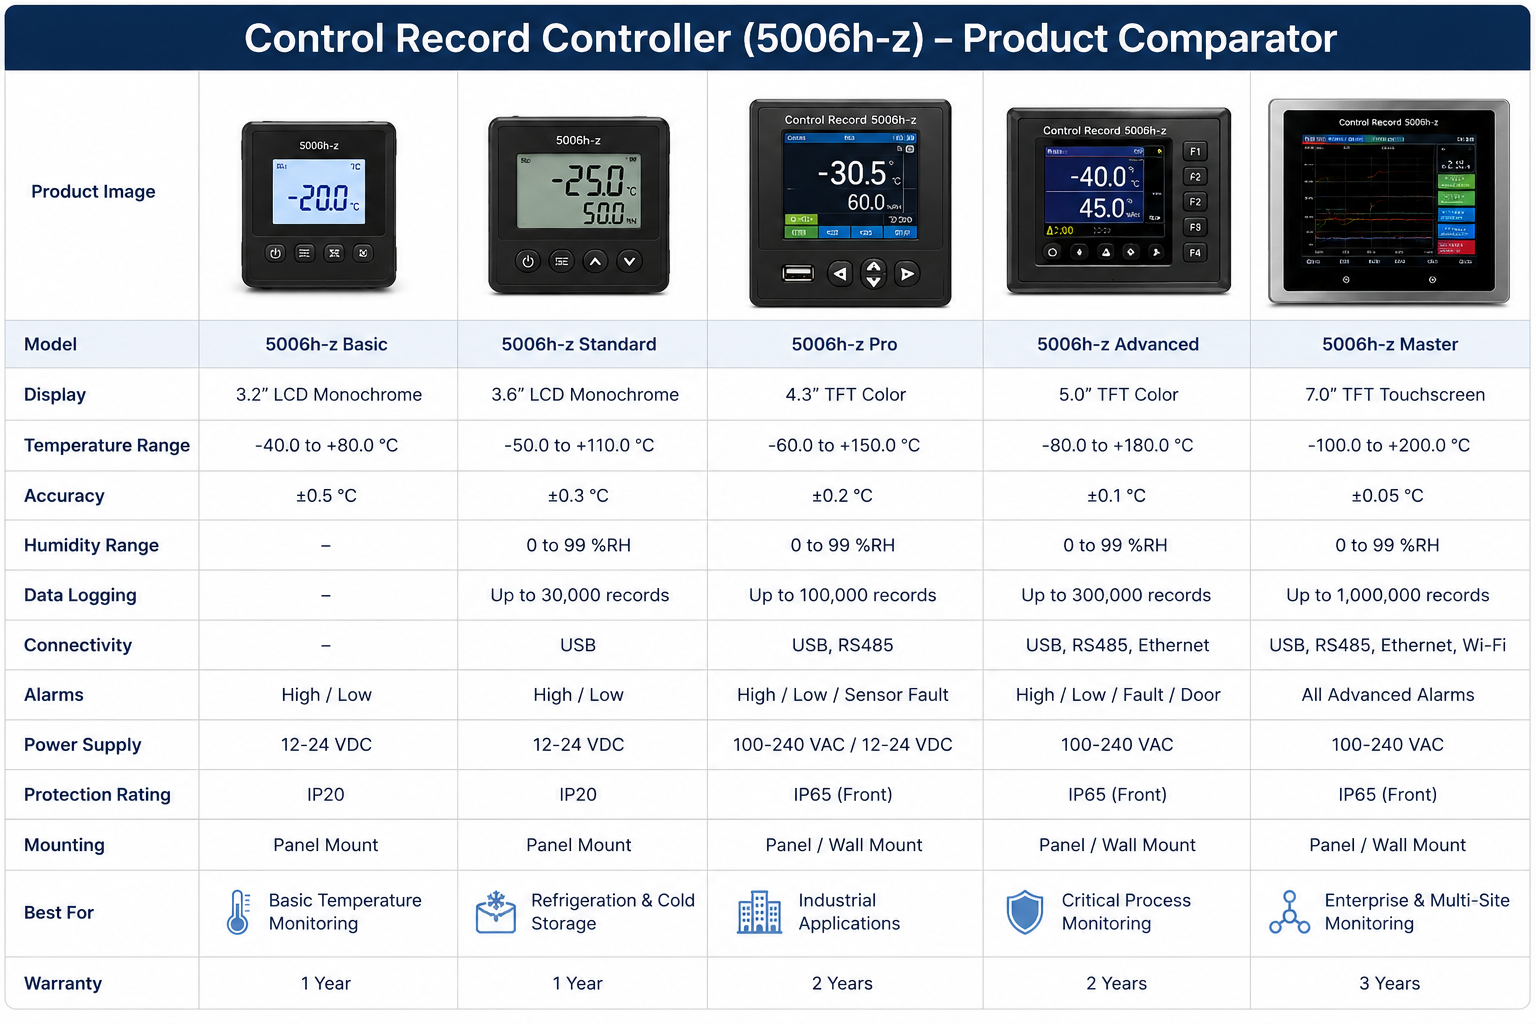
Control Record Controller (5006h-z) Comparator Table
Precision rarely fails loudly at the beginning. Industrial controllers, probes and calibration instruments usually continue operating while small deviations quietly develop in the background. A fraction of a degree, a delayed response or a subtle measurement drift may progressively weaken the reliability of an entire process long before alarms appear. The Control Record Controller (5006h-z) Comparator Table introduces a structured calibration framework designed to detect these hidden variations, validate measurement accuracy and reinforce technical traceability across sensitive industrial environments. More than a verification sheet, this comparator control system becomes a safeguard for operational stability, quality assurance and long-term measurement confidence.
The silent system that protects industrial precision before problems become visible
Industrial equipment rarely loses accuracy overnight. Most measurement problems appear gradually, almost invisibly. A sensor begins drifting by a fraction of a degree. A controller reacts slightly slower than usual. A probe still appears operational, yet its readings slowly move away from reality. Production continues normally, dashboards remain stable and no alarm immediately appears. Nevertheless, the reliability of the entire measurement chain may already be weakening.
This is precisely where comparator calibration becomes essential.
The Control Record Controller (5006h-z) Comparator Table exists to detect these invisible deviations before they begin affecting production quality, safety standards or technical compliance. More than a technical form, it acts as a structured verification system designed to confirm whether an instrument still tells the truth.
In modern industrial environments, that level of certainty becomes invaluable.
Precision does not depend only on technology
It depends on verification
Factories, laboratories and industrial facilities rely upon thousands of measurements every day. Temperatures, pressures, humidity levels and process values constantly influence production decisions. Yet every measuring instrument naturally evolves over time. Components age. Thermal cycles create stress. Environmental conditions gradually influence accuracy.
Without regular calibration, even high-end instruments eventually drift.
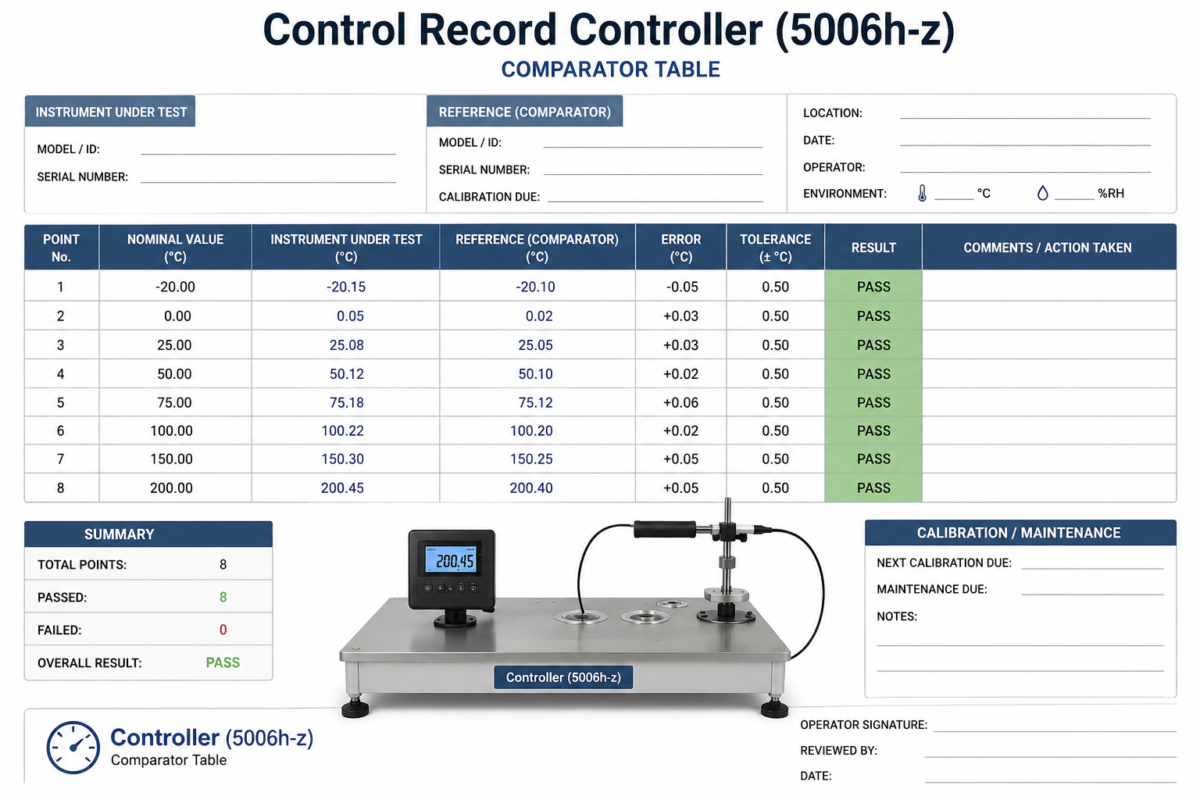
Comparator tables solve this problem by creating a direct comparison between the instrument under test and a certified reference device operating under controlled conditions. The objective remains simple: verify whether the equipment still performs within acceptable limits.
That comparison may appear technical on paper, yet its operational consequences are enormous.
A refrigeration controller displaying an incorrect value may compromise an entire cold chain. A laboratory sensor producing unstable readings may affect analytical reliability. A process controller drifting beyond tolerance may gradually weaken product consistency across a production line.
Calibration therefore protects much more than numbers. It protects operational trust.
The comparator table creates a technical memory of the equipment
One of the most important strengths of the Control Record Controller (5006h-z) Comparator Table lies in its ability to document the complete calibration history of an instrument.
Every entry tells part of the equipment’s story.
Calibration Element
Why It Matters
Reference Values
Provide the certified comparison points used to validate real measurement accuracy.
Protects calibration consistency in sensitive laboratory and industrial environments.
Tolerance Thresholds
Define the acceptable deviation range before technical intervention becomes necessary.
Calibration Intervals
Ensure instruments continue to receive periodic technical verification over time.
Measurement Uncertainty
Shows the possible variation margin surrounding calibration analysis.
Over months and years, this information creates a technical timeline capable of revealing gradual behavioural changes inside the equipment.
This historical visibility becomes extremely valuable for maintenance teams.
The instrument under test remains the centre of the entire process
Every calibration session begins with the instrument itself. Before any measurement comparison occurs, technicians document the equipment identity in order to maintain full traceability.
Instrument Information
Operational Purpose
Model / ID
Identifies the exact equipment undergoing verification.
Serial Number
Maintains long-term maintenance and calibration continuity.
Calibration Due Date
Supports preventive planning and compliance scheduling.
Operator Information
Records technical responsibility during testing procedures.
These details may appear administrative at first glance, yet they form the backbone of industrial traceability.
Without clear documentation, calibration loses much of its long-term value.
PASS and FAIL indicators simplify highly technical decisions
Calibration work often involves complex numerical analysis. Yet industrial environments require fast operational interpretation.
This explains why modern comparator tables increasingly use highly visual validation systems.
Result Status
Operational Meaning
PASS
The instrument remains stable within authorised tolerance limits.
WATCH
Minor drift appears and requires closer monitoring during future calibration cycles.
FAIL
Deviation exceeds acceptable tolerance and corrective action becomes necessary.
This visual structure allows engineers, technicians and supervisors to interpret technical conditions immediately without analysing large quantities of raw data.
Calibration records quietly support preventive maintenance
One of the most underestimated aspects of comparator testing lies in its predictive value.
A single calibration result may appear perfectly acceptable. Yet several calibration sessions observed over time often reveal subtle behavioural trends:
gradual sensor drift;
unstable thermal response;
aging electronic components;
growing environmental sensitivity.
These early warning signs help maintenance teams intervene before serious operational failures emerge.
Comparator tables therefore function as much more than inspection sheets. They become preventive maintenance intelligence tools capable of protecting long-term operational stability.
Industrial reliability begins with trustworthy measurements
Modern production systems rely heavily upon invisible technical precision. Every automated decision, every regulated process and every safety threshold depends upon accurate instrumentation operating correctly behind the scenes.
The Control Record Controller (5006h-z) Comparator Table protects that invisible reliability layer.
It helps industries maintain confidence in their measurements, preserve technical traceability and strengthen the consistency of highly sensitive operational environments.
In reality, calibration control rarely attracts attention when it functions properly. Yet many industrial systems remain stable precisely because these quiet verification processes continue operating in the background with discipline, consistency and precision.
Control Record Controller 5006h-z Comparator Table
Strategic marketing rarely rewards improvisation for long. Behind every successful campaign lies a structured understanding of positioning, customer behaviour, segmentation,