🔧 Preventive Maintenance Tracker in Excel: Your Simple System for Staying Ahead
Recommandés


Ask any facility manager or line worker – when equipment breaks down, it damages more than moments, it damages money, morale, and trust in management. That is why a growing number of operations teams are adopting a strategy of upkeep rather than uptime.
However, the encouraging news is expensive licensing is not necessary for launch.
A neatly organized Excel file designed for maintenance planning can offer precisely what’s required to remain on schedule, lessen unpleasant surprises, and keep assets in tip top form.
Allow me to demonstrate how it functions and why it reworks the game.
✅ What Is a Preventive Maintenance Tracker?
A preventive maintenance tracker is a tool—often built in Excel—that helps you:
- Schedule routine maintenance tasks
- Track when maintenance was last performed
- Assign responsibilities
- Record outcomes and next due dates
- Spot trends in delays, failures, or recurring issues
Instead of juggling sticky notes, whiteboards, or old emails, everything is in one place, visual, and up to date.
🧱 Key Components of a PM Tracker in Excel
A good Excel template includes the following columns or sections:
| Column | Purpose |
|---|---|
| Asset Name / ID | Which machine or equipment is being tracked |
| Location | Helpful for large plants or multiple sites |
| Maintenance Task | What action needs to be performed (e.g., “Lubricate bearings,” “Replace filter”) |
| Frequency | Weekly, monthly, quarterly, etc. |
| Last Done | Date when the task was last completed |
| Next Due | Automatically calculated based on frequency |
| Status | Pending / Completed / Overdue (with color coding) |
| Assigned To | Technician or team responsible |
| Notes / Findings | Room for comments, issues, or parts replaced |
Most of these columns are automated with formulas, drop-down lists, or conditional formatting to make the spreadsheet easy to use and hard to mess up.
🖥️ Why Excel? Isn’t That Too Basic?
Not at all.
In fact, Excel is one of the most practical starting points for small- to mid-sized teams who need structure without the learning curve of CMMS systems.
Benefits include:
- ✅ No software learning required
- ✅ Instant filtering and sorting
- ✅ Easy sharing with others
- ✅ Customizable to your process
- ✅ Compatible with tablet or mobile entry (for field techs)
As your operation grows, you can later import this data into full maintenance software if needed.
🎨 Make It Visual: Status Colors and KPI Dashboards
Color makes everything easier to spot. Use conditional formatting in Excel so:
- Green = Task completed
- Yellow = Due soon
- Red = Overdue
You can also include a summary section at the top:
- % of tasks completed on time
- Total overdue PMs
- Tasks by technician or department
- Monthly trends in compliance
Throw in a few bar charts or donut graphs, and you’ve got a clean, visual dashboard ready for team meetings or audits.
📅 Automating Dates with Formulas
Want your spreadsheet to calculate due dates automatically? Easy.
Use a formula like:
=IF([@[Last Done]]<>"", [@[Last Done]] + [@[Frequency (Days)]], "")
This will keep your Next Due Date always current—and you can then filter for upcoming or overdue tasks without extra manual work.
🧠 How a PM Tracker Helps Your Maintenance Strategy
- Stops emergencies before they start
- Reduces total downtime and overtime
- Protects equipment lifespan and warranty terms
- Improves safety and compliance for audits
- Gives your team a clear plan and accountability
It also builds a culture of discipline. When everyone knows the plan and sees the data, things run smoother.
Ready to Scale? Add Layers
Once the basics are in place, you can add:
- Spare parts inventory tracking
- Maintenance cost logging
- Work order integration
- Vendor or contractor task tracking
- Mobile input forms with Excel + Power Apps
The best part? You grow at your own pace.
A Tracker That Works for You
Preventive maintenance can begin with basic yet beneficial tools. Excel offers a customizable and convenient construct to strategize more sagely, remain liable, and progress ahead of faults—not scamper after them. Construct it accurately from the inception, employ it on a daily basis, and refine it monthly. You will witness the returns in fewer misfortunes, diminished migraines, and considerably elevated outcomes.
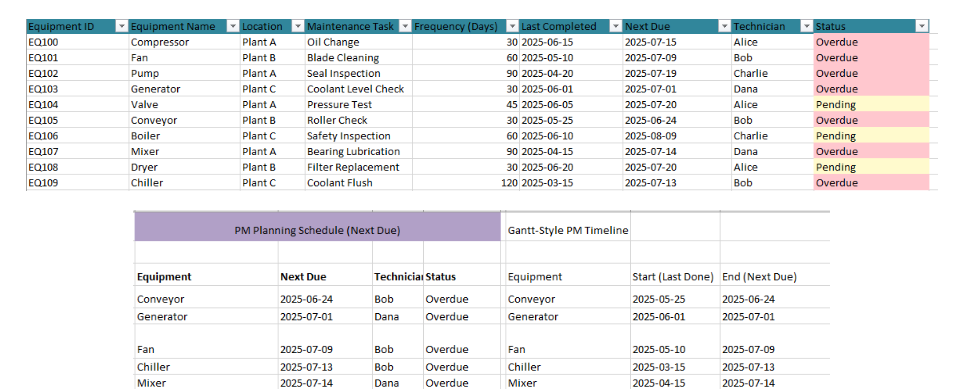
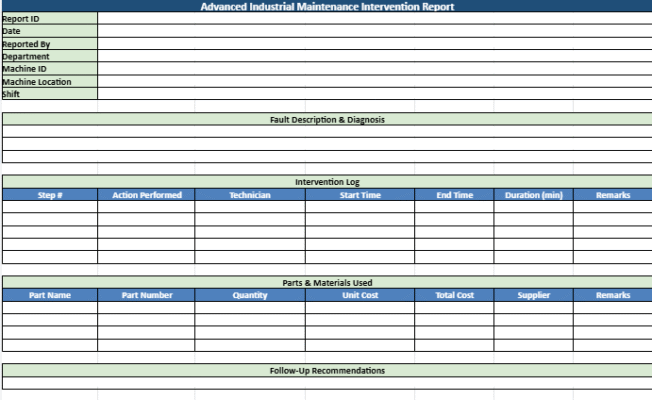
The Preventive Maintenance Tracker (Gantt Edition) is a fully automated Excel tool designed to help maintenance teams plan, track, and optimize preventive tasks with clarity and control. Here’s a breakdown of its key features:
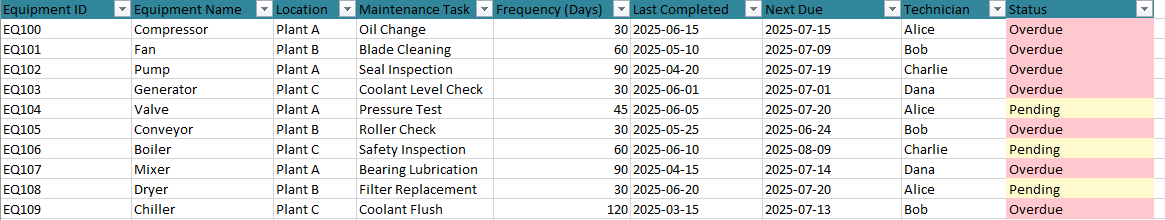
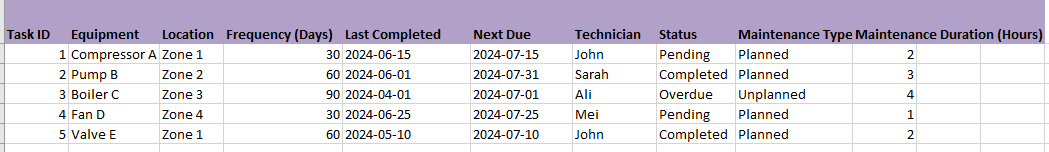
🔧 Maintenance Data Sheet
- Structured Table Format: Tracks all maintenance tasks by equipment, location, technician, frequency, and completion status.
- Automation:
- Automatically calculates next due dates based on last completion and frequency.
- Assigns real-time status as Pending or Overdue depending on today’s date.
- Interactive Filters: Built-in filtering for quick search by equipment, technician, or task status.
- Color Coding:
- Yellow = Pending
- Red = Overdue
- Green = Completed
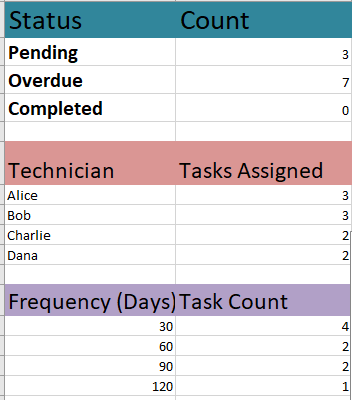
📊 Dashboard
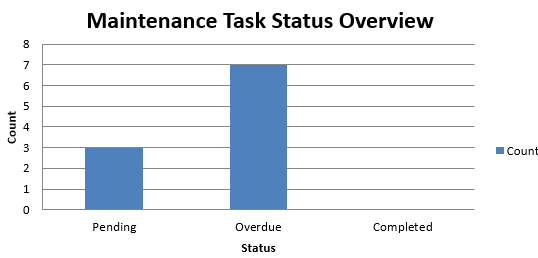
- Task Status Overview:
- Summarizes task distribution by Pending, Overdue, and Completed using formulas.
- Includes a dynamic bar chart to visualize current task status.
- Technician Performance Tracker:
- Counts tasks assigned to each technician.
- Helps monitor workload distribution.
- Frequency-Based Planning:
- Summarizes how many tasks fall under each maintenance frequency (e.g., 30, 60, 90 days).
- Aids in resource scheduling and planning balance.
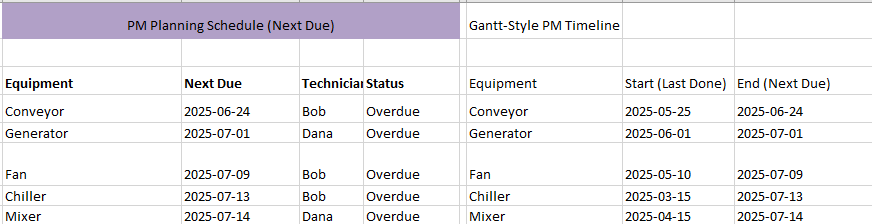
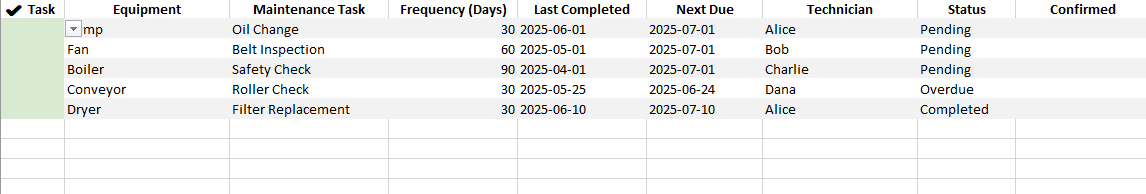
📅 PM Planning Schedule
- Displays the next 5 upcoming maintenance tasks sorted by due date.
- Includes technician, due date, and current task status for each entry.
- Highlights what’s coming up soon to support proactive planning.
📈 Gantt-Style Timeline
- A simplified Gantt chart shows a visual timeline of upcoming tasks.
- Compares last done vs next due dates for top-priority assets.
- Offers a clear view of timeframes to better align scheduling and technician availability.
✅ Who Should Use It?
- Maintenance planners, supervisors, or technicians in industrial facilities.
- Teams looking to reduce downtime, increase equipment reliability, and streamline planning.
To schedule Planned Maintenance Percentage (P%) effectively in your Excel tracker and ensure it becomes a useful KPI, follow this process:
✅ What is P% (Planned Maintenance Percentage)?
Planned Maintenance Percentage (P%) measures how much of your total maintenance time is proactive (planned) rather than reactive (unplanned).
Formula:
P% = (Planned Maintenance Hours ÷ Total Maintenance Hours) × 100
📌 Steps to Schedule and Track P% in Excel
1. Add Columns to Your Tracker
Update your maintenance data sheet with these additional columns:
Maintenance Type(Dropdown: Planned, Unplanned)Maintenance Duration (Hours)- Optional:
Task Category(e.g., Inspection, Repair, Lubrication)
2. Tag Maintenance Entries
When logging each task:
- Select “Planned” for tasks from the PM schedule (based on frequency).
- Use “Unplanned” for unexpected breakdowns or emergency repairs.
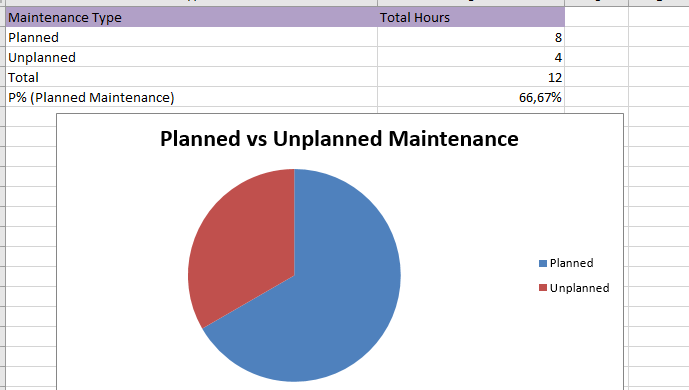
3. Add a Summary Section
Create a table in your Dashboard sheet:
| Type | Total Hours |
|---|---|
| Planned | =SUMIFS(Maintenance Duration, Maintenance Type, "Planned") |
| Unplanned | =SUMIFS(Maintenance Duration, Maintenance Type, "Unplanned") |
| Total | =Planned + Unplanned |
| P% | =(Planned ÷ Total) * 100 |
4. Visualize with a Chart
Add a pie chart or stacked bar chart to visualize P% distribution over time.
5. Track Over Time (Optional)
If you want to monitor monthly trends, create a pivot table based on date and maintenance type to plot P% each month.
Why P% Matters
- A high P% (above 70%) means your team is staying ahead of failures.
- A low P% signals too much reactive work—indicating poor planning or systemic issues.
Scheduling Preventive Maintenance (PM) effectively involves planning maintenance tasks before failures occur, based on time intervals, equipment usage, or condition thresholds. Here’s a step-by-step guide to doing it properly—especially when using a structured tool like your Excel tracker:
🧭 1. Identify Equipment and Maintenance Needs
- List all critical assets in your facility.
- For each asset, determine:
- What maintenance it requires
- How often it should be performed (e.g., every 30, 60, or 90 days)
- Which technician is qualified to do it
Your Excel tracker helps here with the “Frequency (Days)” column and technician assignments.
🗓️ 2. Set the Maintenance Frequency
Use one of the following approaches:
- Time-based (e.g., oil change every 30 days)
- Usage-based (e.g., inspect after 500 machine hours)
- Condition-based (e.g., when temperature exceeds a threshold)
In the Excel tracker, input this frequency under the “Frequency (Days)” column for each task.
📅 3. Calculate Next Due Dates
- For each task, take the “Last Completed” date and add the frequency to get the “Next Due” date.
- Your tracker does this automatically using formulas.
This allows the Gantt view and PM Planning section to visually highlight upcoming deadlines.
🚦 4. Assign Status (Pending, Overdue, Completed)
- If today’s date is past the “Next Due” → mark as Overdue
- If it’s upcoming → Pending
- If recently done → Completed
These statuses are auto-calculated and color-coded in your tracker.
👷 5. Assign to Technicians
- Use the “Technician” column to delegate tasks.
- The dashboard shows how many tasks are assigned per technician so you can balance the workload.
📊 6. Monitor and Adjust with KPIs
Track:
- Number of overdue tasks
- Total assigned per technician
- Maintenance frequency distribution
- Use the dashboard and bar/pie charts to spot gaps
You can also view the PM Planning Schedule for the next 5 due tasks to make real-time adjustments.
🛠️ Best Practices for PM Scheduling
- 🟢 Standardize tasks for similar machines
- 🟢 Automate reminders (with Excel alerts or Outlook tasks)
- 🟢 Review schedules monthly to adjust for changes in usage patterns
- 🟢 Track technician completion rates for accountability
Recommandés