MTBF (Mean Time Between Failures) Tracker in Excel
Recommandés


In maintenance, few metrics are as insightful or impactful as the Mean Time Between Failures. It tells us how extended each piece of equipment usually operates before something goes wrong—and that lone number can reveal a lot about how sufficiently assets are preserved, how dependable they are, and whether existing processes are working.
So, Exactly What Is MTBF?
Simply put, MTBF is the typical period of time a machine works before it breaks down. It’s a reliability metric that applies specifically to systems that can be repaired, not replaced.
The formula is straightforward:
MTBF = Total Operational Time ÷ Number of Failures
Let’s say a unit runs for 1,000 hours and fails twice. Divide 1,000 by 2, and the MTBF is 500 hours.
Why MTBF Deserves Your Consideration
Monitoring MTBF gives maintenance teams a clearer comprehension of:
- How frequently breakdowns occur
- Whether maintenance routines are effective
- Which machines are becoming burdens
A high MTBF usually means a machine is holding up well under normal use. If the number is low, it’s a crimson flag—something needs tweaking.
Where MTBF Fits Into Your Strategy
Here’s how MTBF directly shapes smarter maintenance decisions:
• Predict Failures Before They Happen
Knowing the average time between failures helps you act before things go wrong, rather than reacting after the fact.
• Plan Spare Parts More Proficiently
When you know roughly when a component might fail, you can stock parts accordingly—avoiding both overstocking and last-minute scrambles.
• Identify the Real Problems
A sudden dip in MTBF often signals a deeper issue—worn parts, poor installations, or usage errors. It’s a call to dig deeper.
• Compare Equipment Performance
MTBF lets you benchmark machines across lines or facilities. You can spot outliers and take action where it matters most.
Getting an Accurate MTBF Reading
To truly understand MTBF, the underlying data must be meticulously tracked:
- Log each failure with its precise timestamp.
- Monitor the actual hours of operation—not merely calendar days.
- Exclude scheduled downtimes like routine maintenance from operational hours.
- Define failure in specific terms and apply that definition uniformly.
How It Relates to Other Dependability Metrics
MTBF is one component of a triad of reliability metrics working in tandem:
- MTTR reveals how long repairs normally require.
- Availability measures the percentage of time the system runs smoothly.
Considered together, they provide a panoramic view of performance quality.
A Realistic Workplace Example
Imagine a packaging plant where a conveyor motor has operated for 2,000 hours over six months. During that span, it failed four separate times.
MTBF = 2,000 ÷ 4 = 500 hours
This statistic aids in determining whether the motor demands enhanced maintenance, more frequent inspections, or a replacement component.
Approaches to Lengthen MTBF
To prolong intervals between breakdowns, focus first on:
- Tailoring maintenance regimens to repeat problems.
- Substituting vulnerable parts with sturdier alternatives.
- Educating operators on proper equipment usage.
- Leveraging condition monitoring technologies like vibration sensors or thermal cameras to spot early deterioration signs.
Concluding Observations
MTBF isn’t merely a technical metric—it’s a powerful management tool. When recorded consistently and interpreted correctly, it can reshape maintenance practices, shrink downtimes, and extend asset lifespans.
Transform these insights into training presentations or Excel tools upon request.
Decomposing the MTBF Formula: Understanding Every Element
Mean Time Between Failures (MTBF) is widely used to measure equipment reliability, but its effectiveness depends on understanding how the formula works and what influences the outcome. In this article, we break down the MTBF formula, component by component, to provide clarity for maintenance engineers and reliability professionals.
🔧 The Basic MTBF Formula
MTBF = Total Uptime / Number of Failures
This simple-looking formula carries deeper meaning when we analyze the terms:
🕒 1. Total Uptime (Operating Time)
Definition: The cumulative time that a system or component is fully operational between failures.
Important notes:
- Only productive running time is included.
- Planned downtime (like scheduled maintenance or shutdowns) is excluded.
- Uptime is usually measured in hours, but minutes or days may be used depending on industry norms.
Example:
- A machine runs for 100 hours, stops for preventive maintenance (excluded), then resumes and runs 120 hours before failing. The total uptime = 100 + 120 = 220 hours.
⚠️ 2. Number of Failures
Definition: The count of unplanned breakdowns or malfunctions during the total uptime period.
Key points:
- A “failure” is any event that stops the equipment from performing its intended function.
- Must be clearly defined in your organization—minor faults may or may not count, depending on policy.
- Only repairable failures are considered in MTBF (non-repairable components use MTTF instead).
Example:
- If 3 failures occur over 220 hours, the MTBF is: MTBF = 220 / 3 = 73.33 hours
🔁 Extended Formula with Time Tracking
If you track multiple time intervals:
MTBF = (T₁ + T₂ + T₃ + … + Tn) / n
Where:
- T₁ to Tn = individual time durations between failures
- n = total number of failure intervals
This version helps when recording data from maintenance logs or sensors over time.
🧮 Variants and Clarifications
✅ With First Failure Ignored
Some reliability programs exclude the first failure (because there’s no interval before it):
MTBF = Total Uptime / (Failures – 1)
Use this only when aligning with industry standards that exclude startup conditions or commissioning phase.
🔄 Relationship with Availability and MTTR
MTBF works in tandem with Mean Time To Repair (MTTR) and helps calculate availability:
Availability (%) = MTBF / (MTBF + MTTR) × 100
This shows how MTBF affects overall equipment readiness.
📉 Common Errors in MTBF Calculation
- Including Planned Downtime – skewing the real reliability value.
- Failing to Define “Failure” – inconsistent failure classification affects results.
- Insufficient Data Span – using short or irregular time windows can distort the average.
- Confusing MTBF with MTTF – MTTF is for non-repairable parts; MTBF is for systems that can be fixed and returned to service.
🎯 Best Practices
- Track MTBF by individual equipment to pinpoint weaknesses.
- Use MTBF trends to refine preventive maintenance intervals.
- Combine MTBF with failure modes for targeted root cause analysis.
- Use CMMS systems to automatically compute and log MTBF over time.
📌 Summary Table
| Component | Description | Example Value |
|---|---|---|
| Total Uptime | Productive operating time (no downtime) | 220 hours |
| Number of Failures | Count of breakdown events | 3 |
| MTBF | Uptime ÷ Failures | 73.33 hours |
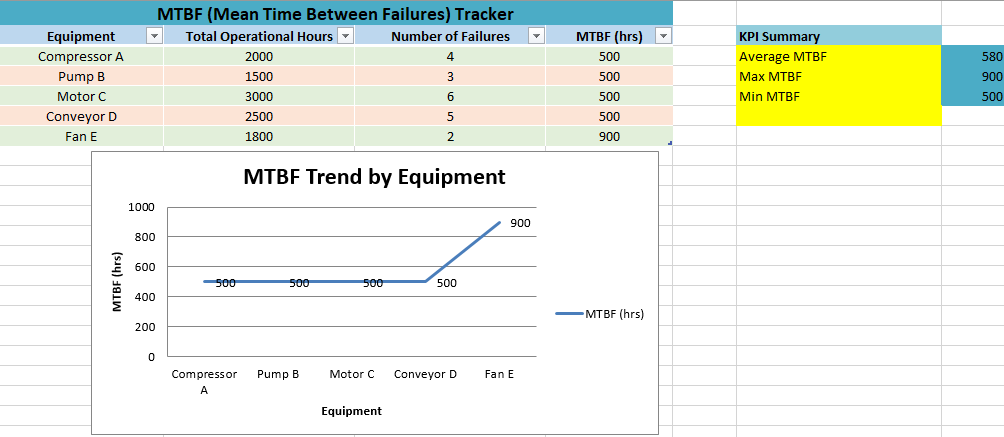
🔧 MTBF (Mean Time Between Failures) Tracker – Description
The MTBF Tracker is a structured and interactive Excel-based tool designed to help maintenance teams calculate, monitor, and analyze equipment reliability over time. By focusing on the average time between equipment failures, this template gives users a real-time view of performance trends and helps support more strategic maintenance decisions.
✅ Key Features
1. Automated MTBF Calculation
- Calculates MTBF for each equipment entry using the formula: MTBF = Total Operational Hours ÷ Number of Failures
- Just enter new operational hours and failure counts—formulas update instantly.
2. Built-in Performance Summary
- Auto-calculated KPIs include:
- Average MTBF
- Maximum MTBF
- Minimum MTBF
- These give an immediate snapshot of fleet-wide reliability.
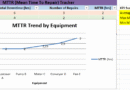
3. Dynamic Charting
- A line chart plots MTBF trends across all equipment.
- It updates automatically as new data is entered or existing data is changed.
- Data labels display exact MTBF values for clarity.
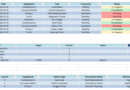
4. Filterable Table
- The equipment data is organized in an Excel table format with:
- Column headers
- Zebra striping for readability
- Filter buttons for sorting or isolating equipment types
5. User-Friendly Layout
- Color-coded rows improve visual navigation.
- Clear headings and structured sections make the tool intuitive—even for non-expert users.
- Notes and KPI summaries are conveniently located alongside the main data for quick reference.
🎯 Use Cases
- Maintenance Planning: Identify which equipment needs more frequent inspections or servicing.
- Inventory Management: Forecast spare part demand based on failure rates.
- Performance Benchmarking: Compare equipment reliability across lines, departments, or locations.
- Reliability Engineering: Support root cause analysis and long-term asset improvement.
💡 Who It’s For
This tracker is ideal for:
- Maintenance supervisors
- Reliability engineers
- Asset managers
- Plant operators
- Industrial analysts
Recommandés