Laboratory Balance Calibration Verification Log: A Complete Guide to Automated Tracking
Download Laboratory Balance Calibration Verification Log Automated in Excel ⬇️
1. Introduction
In laboratories where precision weighing is critical—whether in quality control, research and development, or production support—the reliability of balance measurements is non-negotiable.
Regular calibration and verification ensure that balances operate within acceptable tolerances, maintaining both accuracy and compliance with standards such as ISO/IEC 17025, GMP, and GLP.
An automated Calibration Verification Log offers a structured, error-minimizing approach to tracking calibration results, replacing paper-based logs and manual calculations with a dynamic, interactive Excel tool.
2. Why Use an Automated Calibration Verification Log?
Traditional manual logs can lead to:
- Data entry errors from repetitive manual calculations.
- Missing or incomplete records that jeopardize audit compliance.
- Inconsistent pass/fail criteria due to human interpretation.
An automated log solves these problems by:
- Auto-calculating differences, absolute errors, and pass/fail status.
- Standardizing tolerances by linking to a master balance database.
- Providing instant KPIs like pass rates and monthly trends.
- Offering dropdowns for quick, error-free data entry.
3. Key Components of the Automated Log
3.1 Title and Layout
The log starts with a bold, color-coded title:
“Laboratory Balance Calibration Verification Log (Automated)”,
formatted for clarity and printability in A4 landscape mode.
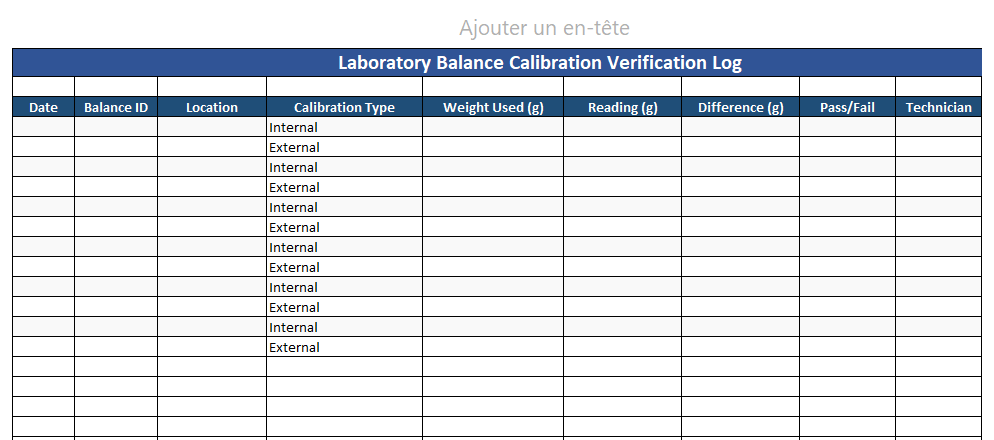
3.2 Main Log Table
The table includes:
- Date – When calibration or verification was performed.
- Balance ID – Selected from a dropdown linked to the master list.
- Location – Automatically populated from the balances database.
- Calibration Type – Dropdown (Internal, External, Verification).
- Weight Used (g) – Reference mass applied.
- Reading (g) – Actual balance measurement.
- Difference (g) – Auto-calculated deviation from the standard.
- Absolute Error (g) – Automatically calculated.
- Tolerance (g) – Pulled from the master database for that balance.
- Pass/Fail – Auto-evaluated based on tolerance compliance.
- Technician – Name of the person performing the test.
- Remarks – Any additional notes.
3.3 Automated Features
- Dropdown lists for Balance ID, Calibration Type, and Location.
- Live formulas to compute:
- Difference between actual and standard weight.
- Absolute error magnitude.
- Pass/Fail decision against the tolerance.
- Conditional formatting:
- Green for PASS.
- Red for FAIL.
- Data validation to prevent incorrect entries.
3.4 Balances Master Data Sheet
This sheet stores:
- Balance ID
- Model
- Location
- Tolerance (g)
It acts as the central reference for the automated formulas, ensuring all tolerance values are consistent and instantly applied in the log.
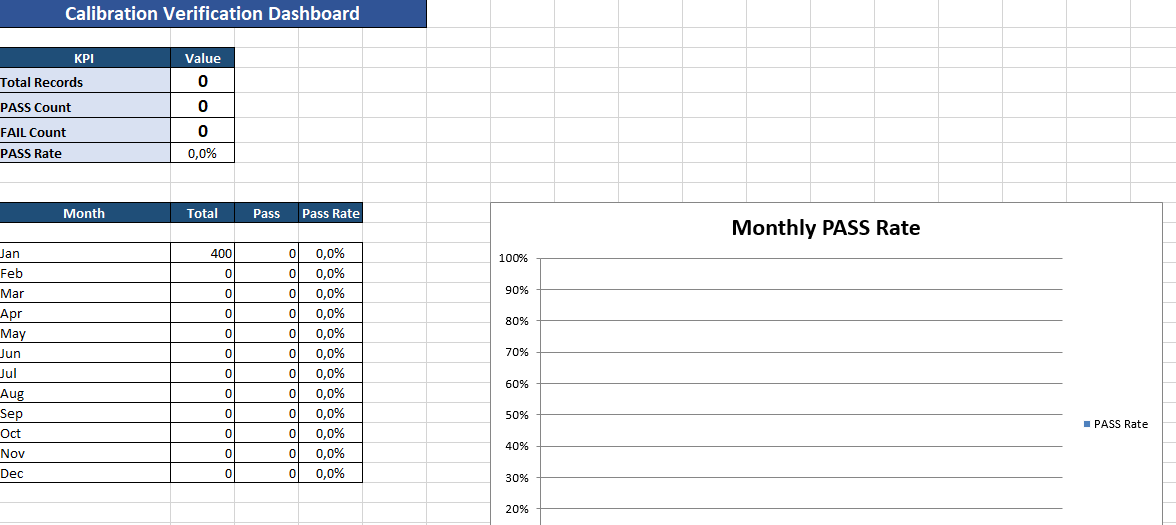
3.5 Dashboard for KPIs
The Dashboard sheet provides:
- Total calibration records.
- PASS/FAIL counts.
- PASS rate (%).
- Monthly breakdown of PASS rates.
- All KPIs update instantly as soon as the log is filled.
4. Benefits of This Automated Log
- Saves time by removing manual calculations.
- Improves accuracy through automation.
- Standardizes calibration records across multiple technicians and sites.
- Simplifies audits with structured, easy-to-read reports.
- Provides instant performance analytics via the dashboard.
5. Best Practices for Use
- Keep the balance master sheet updated with any changes in tolerances or locations.
- Perform calibrations regularly according to SOPs.
- Review PASS/FAIL rates in the dashboard to detect early signs of performance drift.
- Export and archive monthly logs for long-term traceability.
Laboratory Balance Calibration Verification Log Automated in Excel
An Automated Laboratory Balance Calibration Verification Log streamlines the often tedious process of maintaining compliance. By systematically tracking calibration checks, automatically assessing weight measurements, and calculating critical performance indicators, the log keeps important data organized while freeing up lab technicians to focus on other tasks. The sophisticated yet easy-to-use template removes guesswork from confirming accuracy specifications are satisfied. Whether verifying weight calibrations match reference standards or that resulting adjustments fall within set tolerances, the log efficiently ensures equipment is functioning properly and regulatory expectations are met.
Interested in boosting efficiency without sacrificing quality? Give the customizable Automated Excel Template a test run to see how it painlessly puts instrumentation monitoring on autopilot.
1. Sheet: Calibration Log (Main Working Area)
This is the core sheet where technicians enter calibration and verification results.
Structure & Features
- Title:
- “Laboratory Balance Calibration Verification Log (Automated)” in bold, white text, on a dark blue background (#305496).
- Centered and spanning all columns for visibility.
- Columns:
- Date – Date of calibration or verification.
- Balance ID – Dropdown menu linked to the master list in the Balances sheet.
- Location (auto) – Automatically filled from the Balances sheet when a Balance ID is selected.
- Calibration Type – Dropdown list (Internal, External, Verification).
- Weight Used (g) – Reference mass applied.
- Reading (g) – Actual measurement from the balance.
- Difference (g) – Formula:
Reading – Weight Used. - Abs Error (g) – Formula: absolute value of the Difference.
- Tolerance (g) – Pulled automatically from the Balances sheet for the selected Balance ID.
- Pass/Fail – Auto-evaluated by comparing Abs Error to Tolerance.
- Technician – Name of the person performing the test.
- Remarks – Free text for additional observations.
- Automation:
- Formulas auto-calculate Difference, Absolute Error, and Pass/Fail status.
- Conditional formatting:
- PASS appears with a green background.
- FAIL appears with a red background.
- Data validation:
- Balance ID → dropdown from master list.
- Calibration Type → predefined list.
- Location → can also be selected from the list if needed.
- Print Settings:
- Landscape orientation.
- Fits on a single A4 page for easy printing and audit use.
2. Sheet: Balances (Master Data Reference)
This sheet contains all the balance reference data used in the main log.
Columns:
- Balance ID – Unique code for each balance.
- Model – Manufacturer and model name.
- Location – Where the balance is physically located.
- Tolerance (g) – Maximum allowed deviation for PASS criteria.
Purpose:
- Serves as the data source for dropdown lists.
- Feeds the formulas in the main log to auto-fill Location and Tolerance.
3. Sheet: Lists (Dropdown Data Source)
Contains predefined lists for dropdown menus.
Columns:
- Calibration Type – Internal, External, Verification.
- Example Locations – QC Lab A, QC Lab B, R&D Lab, Production Weighing Room.
Purpose:
- Maintains a centralized location for dropdown options, making it easy to update them without editing the main log’s structure.
4. Sheet: Dashboard (KPIs & Summary)
Provides a real-time overview of calibration performance.
KPIs:
- Total Records – Number of completed calibration log entries.
- PASS Count – Number of calibrations that met tolerance requirements.
- FAIL Count – Number of calibrations that failed.
- PASS Rate (%) – Pass ratio over total calibrations.
Monthly Analysis:
- Table showing:
- Month
- Total calibrations
- Pass count
- Pass rate
- Formulas dynamically update as new log entries are added.
Overall Advantages of the File
- Automated calculations reduce human error.
- Dropdowns speed up data entry and standardize input.
- Conditional formatting improves visibility of results.
- Dashboard provides instant performance insights.
- Printable and audit-ready.