Production Capacity Planning Template in Excel Spreadsheet
When Production Pressure Starts to Show
Production rarely becomes difficult all at once. In many factories and workshops, the pressure builds gradually. Orders increase, lead times become tighter, urgent requests start to interrupt the schedule, and teams begin to feel that the available resources are no longer fully aligned with production expectations. At that moment, capacity planning stops being a background task and becomes a central management priority. It is no longer enough to know what needs to be produced. Managers also need to understand what can realistically be produced, with which resources, over what period, and under which constraints. That is precisely where a production capacity planning template in Excel spreadsheet format becomes useful. It offers a structured way to connect demand, labor, machine time, and available working hours, while giving operations teams a clearer basis for planning decisions. In a context where visibility often makes the difference between control and disorder, such a template can quickly become one of the most practical tools on the shop floor.
Why Capacity Planning Deserves More Attention
Capacity planning is often misunderstood as a purely technical calculation. In reality, it sits at the crossroads of production, scheduling, labor management, procurement, and delivery performance. Its purpose is simple in principle: to determine whether the available production resources can meet expected demand during a specific period. Yet behind that simple idea lies a much broader operational question. A company may have strong demand, skilled teams, and functioning equipment, but still experience delays and inefficiencies if workload is not balanced against actual capacity. Capacity planning helps prevent that disconnect. It shows whether a line is overloaded, whether a team has enough hours available, whether an order can realistically fit into the schedule, and whether action is needed before problems intensify. In this sense, it is not only a planning method. It is also a management discipline that helps businesses move from reaction to anticipation.
Capacity planning is often seen as a technical calculation, but its real scope is broader.
It connects production, scheduling, labor management, procurement, and delivery performance.
Its main purpose is to check whether available production resources can meet expected demand over a given period.
Behind this practical goal lies a larger operational challenge: balancing workload with real capacity.
A company may still face delays and inefficiencies even with strong demand, skilled teams, and working equipment.
Excel Still Holds a Strong Operational Advantage
Although advanced planning systems and ERP modules have become more common, Excel still holds a solid place in production environments. One reason is familiarity. Most industrial teams already use spreadsheets for reporting, tracking, stock monitoring, maintenance follow-up, or scheduling support. Building capacity planning in Excel therefore feels natural rather than disruptive. Another reason is flexibility. A spreadsheet can be adapted to one workshop, one production line, several departments, or a complete factory. It can be modified quickly as operational realities evolve, without requiring a long technical deployment. This matters especially for small and medium-sized companies, where planning needs are serious but resources for specialized software may remain limited. Excel also offers immediate visibility. With the right formulas, tables, alerts, and charts, a planning file can reveal overload situations, underused resources, and workload imbalances in a clear format. Used well, it becomes more than a worksheet. It becomes a decision-support instrument.
What Production Capacity Planning Really Means
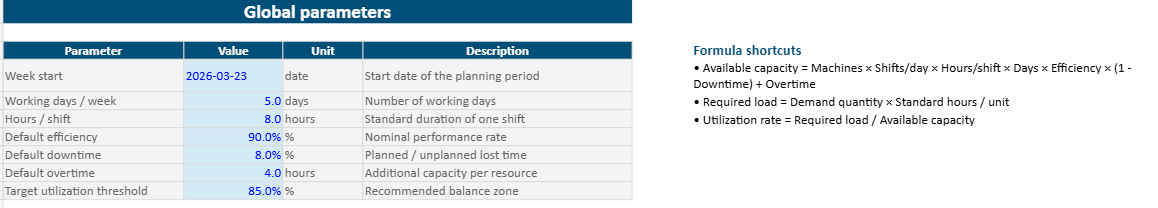
Production capacity planning is the process of measuring how much output can be achieved with the resources available over a given timeframe. These resources usually include machine hours, labor hours, shifts, workstations, available days, and expected efficiency levels. However, effective planning goes further than theoretical maximum output. A machine may be available for eight hours a day on paper, yet real productive time is usually lower once setup, downtime, quality checks, cleaning, and minor interruptions are taken into account.
Serious capacity planning must reflect real operational conditions.
The objective focuses on realistic questions rather than ideal scenarios.
It examines how much a production line can realistically produce in the coming period.
It helps identify where operational pressure may appear in the workflow.
It reveals which resources are already close to saturation.
It evaluates how much capacity remains available for urgent or unexpected work.
It translates operational questions into measurable planning data.
It converts scattered production information into a clearer and more coherent view of operations.
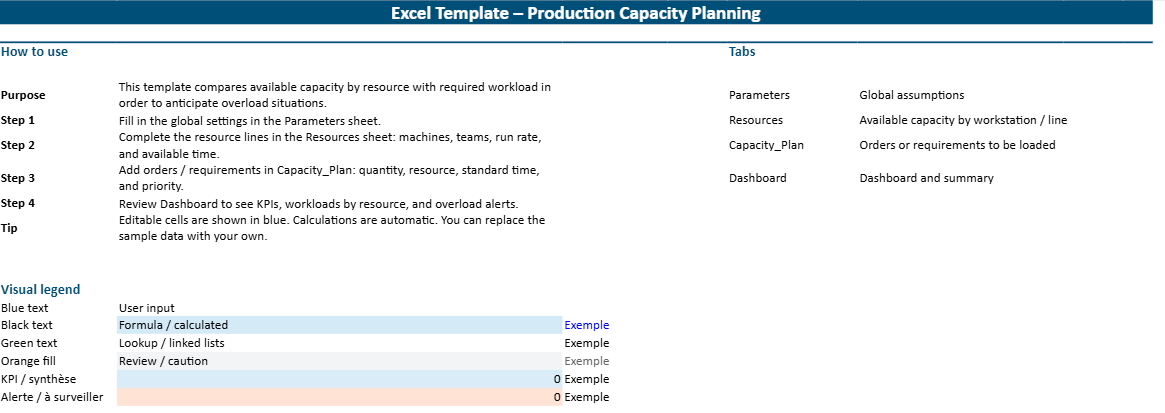
An Excel capacity planning template helps structure this analysis and supports better production decisions.
Looking Beyond Theoretical Output
Many planning errors begin with an overly optimistic idea of capacity. Teams sometimes calculate output based on full working hours without accounting for the inevitable losses that occur in real operations. Breaks, changeovers, absenteeism, maintenance interventions, micro-stoppages, and quality corrections all reduce the actual time available for productive work. When these factors are ignored, schedules may look efficient on screen while becoming unstable in execution. A good Excel capacity planning template helps avoid that trap by distinguishing nominal capacity from effective capacity. This distinction is essential because it produces a more credible planning base. Rather than asking how much output is possible under perfect conditions, the template asks how much can be achieved under normal ones. That shift in perspective makes planning more reliable, helps protect delivery commitments, and reduces the gap between what is promised and what the operation can actually sustain.
Turning Data into Practical Decisions
A capacity planning file should never become a passive archive of numbers. Its real value lies in helping managers make better decisions at the right moment. Once demand and available capacity are entered into the spreadsheet, the comparison between the two quickly becomes meaningful.
If required machine hours exceed the available machine hours, the system immediately reveals operational pressure. If labor demand remains well below the hours available, additional production or internal reallocation may be possible. These signals help managers understand the real balance between workload and resources.
What a Strong Excel Template Should Contain
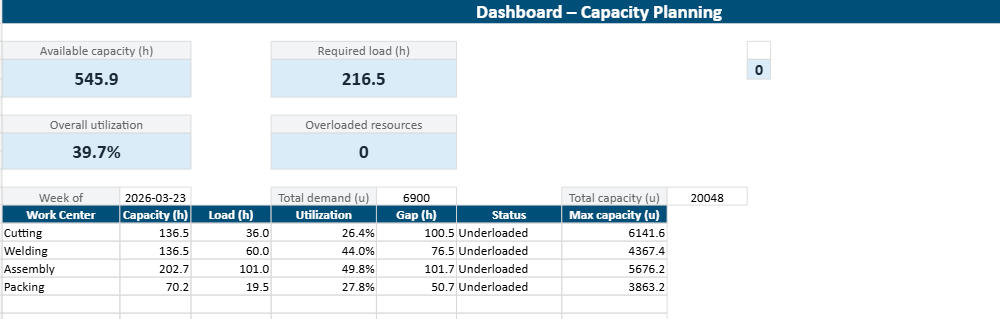
The workload section usually includes products, orders, forecast quantities, production time per unit, and the machine or labor hours needed to complete them. Once these two sides are connected, the template can calculate utilization rates, capacity gaps, overload percentages, and remaining available hours.
Many well-designed templates also include a summary dashboard so managers can read the planning situation quickly. When these components are arranged clearly, the spreadsheet becomes a practical control panel rather than a set of disconnected tables.
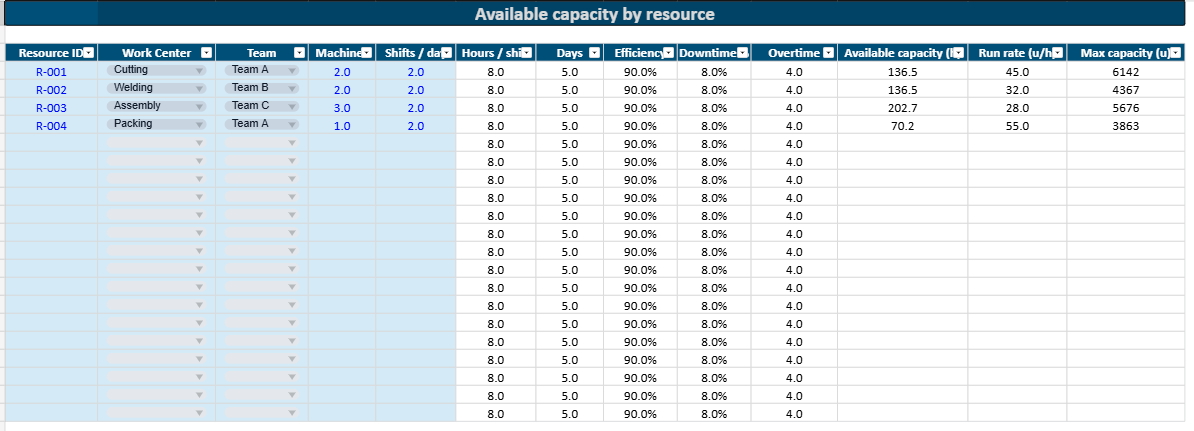
A Clear View of Available Resources
Any useful capacity plan begins with clear visibility into the production resources that are actually available during the chosen period. This usually includes the number of active workstations, total machine hours, labor hours, scheduled shifts, and effective working days.
In more advanced spreadsheets, this section may also include maintenance downtime, training days, operator absences, and expected efficiency coefficients. These details matter because production capacity rarely remains stable from one week to the next.
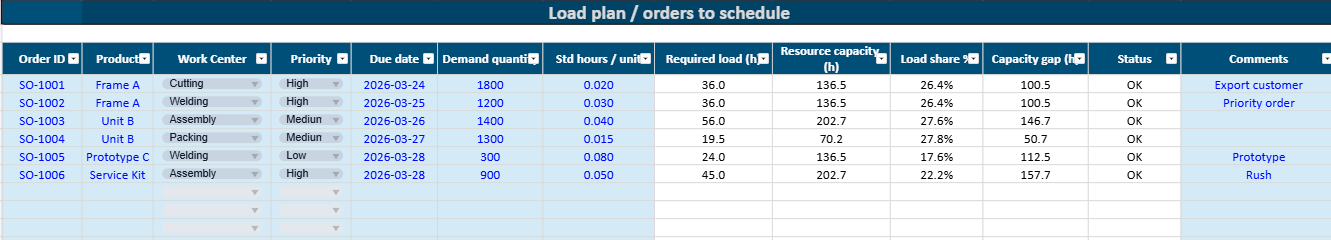
A Practical Translation of Demand into Workload
Demand must be translated into hours before it can be compared with capacity. That is one of the central functions of the template. Orders, forecasts, or planned quantities are entered into the spreadsheet, along with standard time per unit or time per batch. The file then calculates how many machine hours or labor hours each item will require. This translation is critical because volumes alone do not reveal planning pressure. Producing 500 units of one item may require far less time than producing 200 units of another. Once the required hours are calculated, the workload can be allocated by machine, by line, by product family, or by team. This makes the planning analysis far more meaningful. Managers no longer see demand as a list of quantities alone. They see it as a structured load applied to real production resources over a defined period.
A Direct Comparison Between Load and Capacity
This is the moment when the spreadsheet begins to generate real operational value. Once the required workload is calculated and the available capacity is defined, the file can compare the two directly. This comparison reveals whether each resource is balanced, under pressure, or underutilized.
Load ratios, utilization percentages, and capacity gaps become particularly helpful at this stage because they make the results easier to interpret. A workstation loaded at 112 percent immediately signals a constraint, while a team loaded at 78 percent indicates that some flexibility remains.
Dashboard That Makes the Situation Easier to Read
A planning spreadsheet becomes even more useful when it includes a dashboard. Managers often need a concise visual summary rather than a detailed review of every row. A dashboard can bring together the most important indicators in one space: total available hours, required hours, overall utilization rate, overload by resource, remaining capacity, and workload distribution over time. Charts can highlight saturation points, while conditional formatting can make urgent issues immediately visible. This visual layer improves communication as much as analysis. It allows production managers, supervisors, and even directors to understand the planning situation quickly, especially during operational meetings. A dashboard does not replace the detailed planning tables behind it, yet it translates them into a more readable management view. That makes the spreadsheet more practical, more shareable, and more likely to be used consistently.
The Spreadsheet Columns That Make the Difference
The quality of a capacity planning file depends heavily on the structure of its columns. Clear fields lead to clear analysis, while vague or inconsistent data make the entire planning model weaker. Most templates begin with a product code, order reference, or production family. These identifiers allow the planner to track each production requirement in a stable way. Planned quantity comes next, followed by standard time per unit or standard time per batch. These values allow the spreadsheet to calculate the hours required. Additional columns often specify the machine, line, or department concerned, along with the team assigned to the work. On the capacity side, other fields may include available machine hours, available labor hours, expected downtime, and effective working time. The final analytical columns usually show required hours, utilization rate, gap in hours, overload status, and possible action. This structure turns the spreadsheet into a readable operational map rather than a simple list of figures.
Product References, Volumes, and Time Standards
These fields form the basis of the entire planning model because they translate production demand into a measurable workload. Product references help distinguish one order or item from another, especially in environments that handle multiple part numbers, product families, or customer-specific variations. Planned quantities indicate how much output is expected during the selected period. Time standards then convert those quantities into the number of hours needed for production. These standards may refer to machine time, labor time, or both depending on the process. Their accuracy matters greatly. If the standard times are outdated or unrealistic, the planning results become misleading. For that reason, strong capacity planning files often rely on validated operational standards rather than assumptions. Once these fields are well maintained, the spreadsheet begins to provide a much more reliable picture of the workload the production system will have to absorb.
Machine Hours, Labor Hours, and Resource Allocation
One of the most useful aspects of a capacity planning template is its ability to distinguish between different types of resources. Machine capacity and labor capacity do not always move together. A department may have enough equipment hours available but not enough qualified operators. Another may have the labor available but still be constrained by machine access. This is why strong spreadsheets often calculate these two dimensions separately. Each production requirement is allocated to the relevant machine, line, department, or team, allowing planners to see where the real pressure lies. This resource-based allocation prevents planning from remaining too generic. It brings the analysis much closer to operational reality. Once managers can see which resources are overloaded and which still have room, they can start redistributing work more intelligently and avoiding unnecessary bottlenecks.
Capacity Gaps, Load Ratios, and Warning Signals
The final analytical columns are where the spreadsheet becomes truly decision-oriented. Capacity gap shows the difference between available hours and required hours. Load ratio expresses the relationship between the two as a percentage. Warning signals, often created through conditional formatting, help highlight the most urgent cases automatically. These indicators make planning easier to read and easier to act upon. A resource loaded at 103 percent calls for a different response than one loaded at 145 percent. A machine family with repeated overload across several weeks may indicate a structural bottleneck rather than a temporary issue. The spreadsheet can make those patterns visible, especially when historical tracking is added. These warning signals help managers focus their attention where it matters most. They also improve communication by reducing ambiguity. The issue is no longer described as a vague feeling of pressure. It becomes a visible and measurable planning fact.
How the Template Works in Everyday Operations
In day-to-day use, the spreadsheet usually begins with the planning horizon. Some companies work by week, others by month, and some combine both views. Once the period is selected, the planner updates the available capacity for each relevant resource. This may include machine hours, labor hours, number of active shifts, or known restrictions such as downtime and holidays. Demand is then entered through confirmed orders, forecast volumes, or internal production targets. The spreadsheet uses formulas to convert this demand into required hours, usually based on standard time data. The resulting workload is then compared against the available capacity by resource. This comparison shows immediately where production is feasible and where pressure is building. At that point, the file supports adjustments. Work may be rescheduled, split across periods, transferred to another line, or supported with overtime. In practice, the template becomes a planning routine that helps teams manage capacity with more discipline and less guesswork.
Starting with Available Capacity
The planning process should begin with a reliable picture of what the production system can actually provide over the selected period. This means identifying the number of working days, shifts scheduled, machines available, and labor hours expected. It also means reducing that figure when specific constraints are already known. If maintenance is planned, a machine will not provide full capacity. If absenteeism is expected or training is scheduled, labor availability may need to be adjusted. This first step may appear basic, yet it determines the credibility of the rest of the plan. When capacity is overstated at the start, every decision that follows becomes more fragile. A disciplined Excel template encourages planners to establish this foundation carefully. Once the true production base is visible, workload can be compared against it in a way that supports more realistic commitments.
Matching Orders with Production Resources
Once the capacity base is set, the next step is to connect demand to the resources that will carry it. Each order, forecast, or production requirement is entered into the spreadsheet with its associated time standard and resource allocation. The file can then calculate how many hours that demand will consume on each machine, line, or team. This matching stage is where hidden imbalances often emerge. A total workload may appear manageable at first glance, yet once allocated by resource, certain parts of the system may prove overloaded while others still have available time. This is why resource-specific analysis is so important. It reveals the operational shape of demand rather than leaving it at a purely aggregate level. In daily management, that visibility helps planners schedule with greater accuracy and helps supervisors understand where the week is likely to become more difficult.
Adjusting Before Pressure Turns Into Disruption
The real strength of capacity planning lies in the ability to intervene early. Once overload or imbalance becomes visible in the spreadsheet, managers can begin exploring alternatives before execution is compromised. They may move an order to another period, split the production batch, authorize overtime, assign extra labor, or subcontract a portion of the work. In some cases, they may simply revise the delivery commitment before the customer relationship is affected. These are not minor benefits. They can protect service level, reduce stress on teams, and improve the overall stability of operations. A spreadsheet that supports this kind of anticipation is far more valuable than a file used only for reporting after the fact. It allows production management to become more deliberate and less reactive. In operational environments where time pressure is constant, that difference is often decisive.
Why This Type of Template Supports Better Decisions
A production capacity planning template improves decisions because it brings structure to a part of operations that is often managed through fragmented information. Instead of relying on separate reports, verbal updates, or intuition alone, managers can work from a common planning framework. This matters because production decisions are rarely isolated. A scheduling change affects labor needs, machine loading, material requirements, and delivery promises at the same time. The template helps reveal those connections more clearly. When overload is visible early, a company can react with more control. When spare capacity appears in one area, it may be used more strategically. Over time, the spreadsheet also improves the quality of discussion between departments. Production, planning, maintenance, and procurement can review the same workload picture and coordinate their responses more effectively. That creates a stronger planning culture overall.
Earlier Visibility on Overload Risks
Many production problems become expensive because they are discovered too late. By the time delays, overtime pressure, and missed priorities appear on the floor, the room for calm adjustment has often narrowed. Capacity planning helps move that visibility upstream. Instead of discovering overload during execution, managers can identify it while planning is still flexible. This earlier warning supports more thoughtful decisions. The team may re-sequence work, adjust batch sizes, increase support on a constrained area, or delay less urgent tasks. The point is not to remove all pressure from production. Industrial operations always involve trade-offs. The point is to see the pressure early enough to manage it well. That is one of the strongest reasons why a capacity planning spreadsheet remains useful. It helps planners act before disruption becomes visible to customers, suppliers, or exhausted teams.
Better Balance Across Teams and Equipment
In many factories, the issue is not only that demand is high. It is that demand is unevenly distributed across resources. Some teams become overwhelmed while others remain less loaded. Certain machines operate near saturation while nearby equipment still has room. These imbalances create inefficiency as much as overload. A strong spreadsheet helps detect them by showing utilization by machine, by line, by department, or by team. That visibility supports more balanced decision-making. Managers can reallocate certain jobs, shift people between tasks, or smooth the production rhythm over the planning horizon. A more balanced load often improves quality of execution as well as productivity. It reduces the pressure concentrated on a few points in the system and allows resources to be used more coherently. In that sense, capacity planning contributes not only to feasibility, but also to overall operational harmony.
A Stronger Link Between Planning and Purchasing
Production planning and material planning are closely linked, even when they are managed by different teams. If capacity is planned poorly, raw material needs also become harder to anticipate. Urgent schedule changes may trigger rushed purchases, stock imbalances, or shortages at the wrong moment. A capacity planning spreadsheet improves this relationship because it creates a more realistic production picture. Once volumes are aligned with feasible machine time and labor availability, procurement can forecast needs with more confidence. This strengthens coordination between departments and reduces unnecessary tension. It also helps avoid overcommitting materials to a schedule that was not realistic in the first place. The result is a more stable chain of decisions, from planning to purchasing to execution. This is one of the more understated benefits of a good Excel template, yet in practice it can improve operations well beyond the production office.
Where Bottlenecks Become Impossible to Ignore
Every production system has constraints. Some resources quietly determine the pace of the whole operation because they are more heavily loaded, less flexible, or more difficult to replace than others. These bottlenecks may be a machine family, a specialized team, a setup-intensive process, or a control step that limits the overall flow. Capacity planning makes these pressure points easier to identify. When utilization is measured by resource and tracked over time, patterns begin to emerge. Certain machines remain above 100 percent load repeatedly. Certain departments struggle each period while others remain more comfortable. These recurring imbalances matter because they shape the practical capacity of the whole system. Once bottlenecks become visible, the company can focus improvement efforts more intelligently. Rather than spreading actions everywhere, it can direct attention toward the points that truly limit performance.
Identifying the Resources That Shape Output
Not every resource carries the same strategic weight. Some workstations may be busy, yet still have enough flexibility to absorb variation. Others sit at the center of the process and limit everything around them. A capacity planning template helps distinguish between the two by showing which resources remain persistently constrained. This analysis becomes even more useful when several planning periods are reviewed together. A one-time overload may simply reflect an unusual order pattern. Repeated overload often points to a deeper structural issue. That may involve insufficient machine capacity, a shortage of skilled operators, long setup times, or weak process reliability. By identifying the real limiting resources, the spreadsheet allows managers to act with greater focus. In many industrial settings, that clarity is far more valuable than generic productivity targets.
Focusing Improvement Where It Creates the Most Value
Once bottlenecks are visible, improvement efforts can become much more targeted. A company may choose to reduce setup time on the constrained machine, cross-train operators for the overloaded process, revise sequencing rules, invest in additional equipment, or reschedule lower-priority work. These decisions become stronger when they are supported by visible planning data rather than assumptions. Capacity planning therefore connects short-term scheduling with longer-term improvement strategy. It does not only answer the question of whether next week’s demand fits. It also helps reveal why certain planning difficulties keep returning. That insight can support investment decisions, staffing plans, and process improvement initiatives. In that sense, the Excel template contributes not only to immediate control but also to more intelligent development of the production system over time.
The Mistakes That Can Weaken a Capacity Planning Spreadsheet
An Excel file does not become useful simply because it contains formulas. Some spreadsheets look sophisticated but remain fragile because the assumptions behind them are weak or the structure is too difficult to maintain. One common mistake is building the model around theoretical capacity rather than effective capacity. Another is ignoring setup time, variability, or real process losses. Some files become overly complex, with hidden formulas and unstable links that reduce confidence instead of strengthening it. Others rely on outdated time standards that no longer reflect current production performance. In all these cases, the spreadsheet may still produce numbers, but those numbers become less actionable. A good capacity planning template should remain readable, credible, and close to the operational realities of the site. Simplicity and reliability usually create more value than unnecessary sophistication.
Relying on Ideal Capacity Instead of Effective Capacity
The most common planning error is assuming that all scheduled hours are fully productive. In reality, production time is always affected by unavoidable losses. Breaks, tool changes, material waiting, maintenance interruptions, inspections, and small disruptions reduce the hours truly available for output. When a spreadsheet uses ideal capacity as its baseline, it tends to overestimate what the system can absorb. This creates unrealistic schedules and increases the risk of disappointment during execution. Effective capacity is a more useful reference because it reflects the production conditions that teams actually face. A strong template should therefore leave room for downtime assumptions, efficiency rates, or other adjustment factors that make the model more realistic. This one correction can significantly improve the quality of planning decisions.
Ignoring Setups, Variability, and Operating Losses
Production rarely flows in a perfectly stable rhythm. Batches change, setups vary, material issues appear, and performance shifts from one period to another. When these realities are excluded from the spreadsheet, the planning model becomes too rigid and optimistic. Setup time is especially important in multi-product environments, where frequent changes can consume a substantial share of available hours. Variability also matters because production does not perform exactly the same way every day. A useful capacity planning file does not need to model every detail, yet it should acknowledge that variation exists. Including reasonable allowances for setup and routine losses usually makes the schedule more credible. It also helps build trust in the template, since users can recognize their daily reality in the numbers being presented.
Making the File Too Complex to Be Trusted
There is a point where a spreadsheet stops helping and starts intimidating its users. Files that are overloaded with hidden formulas, too many tabs, complicated logic, or unstable references may appear advanced, but they often become difficult to maintain. If users do not understand how the results are produced, they are less likely to trust them. A capacity planning template should therefore remain clear enough to be reviewed, updated, and explained without confusion. Transparency matters. Key assumptions should be visible. Inputs should be separated from calculations. Warning signals should be easy to interpret. In many cases, a simpler spreadsheet used consistently is far more valuable than a highly technical model that nobody feels comfortable updating. Operational tools create value when they are used with confidence, not when they look impressive in isolation.
How to Make the Template More Valuable Over Time
Comparing actual performance with planned capacity is one of the strongest ways to improve the model. If certain resources appear more constrained than expected, time standards or availability assumptions may need revision. Historical tracking can also add more depth by revealing repeated overload patterns, seasonal peaks, or persistent underutilization.
As the spreadsheet evolves, it becomes more than a planning support tool. It turns into a source of insight that helps managers understand how the production system behaves and where improvement efforts should be focused.
Start Simple, Then Strengthen the Model
A common temptation is to build an all-encompassing spreadsheet from the start. In practice, this can slow adoption and make the tool harder to trust. A better approach is often to begin with one workshop, one department, or one family of resources. This makes the file easier to validate and easier to improve. Once the core logic proves useful, the model can be extended gradually. This step-by-step development supports stronger ownership among users because they can see how the spreadsheet connects to real decisions. It also reduces the risk of building a planning system that is technically detailed but operationally disconnected. Starting with a narrower scope often leads to a stronger template in the long run.
Keep Standards Connected to Reality
Time standards and capacity assumptions should never remain frozen for too long. Processes change, teams gain experience, products evolve, and equipment performance can improve or deteriorate. If the spreadsheet continues to rely on outdated standards, the analysis becomes less reliable with each planning cycle. That is why periodic review is so important. Comparing standard times with recent actual performance helps detect drift and correct it before it becomes harmful. The same applies to availability assumptions. If downtime patterns or staffing realities have changed, the capacity base should be updated accordingly. A planning tool remains valuable only when it stays connected to the operation it is meant to support.
Add Visual Signals That Support Faster Reading
Managers often work under time pressure and cannot read every planning line in detail. Visual signals therefore make the spreadsheet more effective. Color-coded load alerts, utilization bars, summary indicators, and dashboard charts can turn a dense planning file into a much more readable instrument. These features should remain purposeful rather than decorative. Their goal is to help users identify overload, spare capacity, and trends quickly. When designed well, visual signals improve both analysis and communication. They make it easier to discuss priorities during meetings and easier to focus attention on the resources that need immediate decisions. In practical terms, they often increase the day-to-day usefulness of the file significantly.
Who Can Benefit Most from This Excel Template
A production capacity planning template in Excel can create value across many industrial settings. Manufacturing plants can use it to balance machine loading and labor hours. Workshops can use it to schedule jobs against available workstations. Assembly operations can compare forecast demand with real operator time. Maintenance-intensive environments can incorporate downtime constraints more explicitly into production plans. Small and medium-sized companies often benefit especially strongly because they need disciplined planning without the weight of a large software implementation. Yet larger organizations can also gain value from local spreadsheets at department or supervisory level, especially for short-term analysis or scenario testing. The strength of the tool lies in its adaptability. It can serve as a starting point for growing operations or as a complementary working file in more mature industrial organizations.
A Practical Tool for Growing Operations
For growing businesses, production complexity often increases before planning systems fully mature. Orders diversify, resources become more specialized, and the margin for improvisation becomes narrower. At that stage, an Excel capacity planning template offers structure without excessive complexity. It helps managers introduce more discipline, quantify workload more clearly, and strengthen coordination across teams. It also supports a better understanding of where future investment or staffing decisions may be needed. Because the spreadsheet remains flexible, it can evolve with the business rather than locking it into a rigid planning framework too early. This makes it especially useful for companies that are expanding and need clearer operational visibility without losing agility.
A Useful Working File Even in Larger Companies
Even in companies equipped with ERP or advanced planning systems, local Excel templates often continue to serve a valuable role. Managers and supervisors frequently need a flexible file for quick analysis, operational meetings, resource balancing, or what-if scenarios that larger systems do not always handle conveniently. In this context, Excel does not compete with the formal system. It complements it. It provides a closer, more adaptable view of the short-term planning reality. When used with discipline and connected to reliable source data, it can support daily production management very effectively. That continued relevance explains why spreadsheets remain present even in sophisticated industrial environments.
Why This Excel Template Still Deserves Its Place
The continuing relevance of a production capacity planning template in Excel spreadsheet form comes from one essential quality: clarity. It brings together demand, labor, machine time, and available hours in a format that is easy to read, easy to update, and immediately useful for operational decisions. It helps managers see whether the schedule fits the resources, where bottlenecks are forming, and what kind of response may be needed. In a production setting, that visibility has real value. It supports more realistic planning, more balanced use of resources, and stronger coordination between departments. Excel may not replace every planning system, yet it remains one of the most practical tools for building a disciplined view of capacity. When designed well, it becomes much more than a spreadsheet. It becomes a working framework for better production control.
Summary Table
Production Capacity Planning at a Glance
A concise overview of the core elements that shape a practical production capacity planning process in Excel.
Planning Area
What It Includes
Why It Matters
Demand Input
Customer orders, forecast volumes, product references, due dates, and production priorities.
Creates the starting point for workload estimation and planning alignment.
Available Capacity
Machine hours, labor hours, shifts, working days, downtime, and efficiency assumptions.
Shows how much production the operation can realistically absorb.
Workload Calculation
Planned quantities converted into required machine and labor hours using standard production times.
Transforms demand into measurable capacity consumption.
Load vs Capacity
Required hours, available hours, load percentage, remaining capacity, and overload flags.
Reveals pressure points, underused resources, and planning feasibility.
Decision Actions
Overtime, rescheduling, reallocation, subcontracting, staffing reinforcement, or priority revision.
Supports faster and more realistic operational responses.
Dashboard Monitoring
KPIs, utilization trends, bottlenecks, remaining hours, and overall planning balance.
Makes the planning situation easier to read, share, and manage.
Core planning logic: Demand is translated into required hours, then compared with real available capacity to guide scheduling, resource balancing, and production decisions.
Conclusion
A production capacity planning template in Excel spreadsheet format remains one of the most accessible and effective tools for turning operational complexity into structured planning logic. It helps companies move beyond rough estimates and build a clearer understanding of what their resources can realistically deliver. By comparing demand with effective capacity, identifying overload early, and revealing the bottlenecks that shape performance, the template supports decisions that are both faster and more grounded. Its value lies in its practicality. It can be adapted, shared, improved, and used immediately by teams that need visibility more than theory. In an industrial environment where precision and responsiveness often determine results, that kind of tool continues to deserve its place.
FAQ Production Capacity Planning Template in Excel
Questions fréquentes sur le capacity planning en Excel, le calcul de charge, la capacité disponible, les goulots d’étranglement et le suivi de production.
What is production capacity planning in Excel?
Production capacity planning in Excel is the process of comparing expected demand with the real production resources available over a given period. It helps teams understand what can actually be produced with available machine time, labor hours, shifts, and working days.
Why use an Excel spreadsheet for production capacity planning?
Excel remains useful because it is familiar, flexible, and easy to adapt to one workshop, one line, several departments, or a whole factory. A well-built spreadsheet can combine formulas, alerts, tables, and charts to make overload and underutilization easier to detect.
What is the difference between theoretical capacity and effective capacity?
Theoretical capacity is the maximum output based on full working time on paper. Effective capacity is lower because it reflects real operating conditions such as setup time, downtime, quality checks, cleaning, breaks, absenteeism, and minor stoppages.
What data should a production capacity planning template include?
A strong template usually includes available machine hours, available labor hours, shifts, working days, expected downtime, products or orders, planned quantities, standard time per unit or batch, required hours, utilization rate, capacity gap, and overload status.
How do you calculate required production hours in Excel?
Required production hours are usually calculated by multiplying planned quantity by standard time per unit, or by applying the standard time per batch where relevant. This converts demand into a measurable workload that can be compared directly with available capacity.
How does Excel show whether a production line is overloaded?
Once required hours and available hours are entered, Excel can calculate utilization rates, load ratios, and capacity gaps. A result above 100 percent usually shows overload, while a lower ratio may indicate remaining flexibility.
What is a capacity gap in production planning?
A capacity gap is the difference between the workload required and the capacity available. A negative gap usually means the resource is overloaded, while a positive gap suggests there is still room to absorb more work.
Can Excel help identify bottlenecks in production?
Yes. When workload is allocated by machine, line, department, or team, the spreadsheet can show which resource is close to saturation or repeatedly overloaded. This makes bottlenecks much easier to identify before delays spread through the schedule.
Why should machine hours and labor hours be tracked separately?
Because a department may have enough machine capacity but not enough qualified operators, or the opposite. Tracking these two dimensions separately makes the analysis more realistic and helps managers act on the real constraint rather than a simplified average.
What is a load ratio in a capacity planning spreadsheet?
A load ratio expresses the relationship between required hours and available hours as a percentage. It helps planners read pressure quickly and compare resources more easily across the same planning horizon.
What kind of dashboard should a production capacity planning file have?
A useful dashboard can show total available hours, required hours, utilization rate, remaining capacity, overload by resource, and workload distribution over time. This gives managers a faster reading of the situation than detailed tables alone.
How does a production capacity planning template support daily operations?
In everyday use, the planner updates the planning horizon, available capacity, known restrictions, and expected demand. The spreadsheet then compares the required workload with the available resources and helps the team decide whether to reschedule, shift work, add overtime, or rebalance production.
Can small and medium-sized companies use production capacity planning in Excel?
Yes. Excel is especially practical for companies that need serious planning discipline without investing immediately in specialized planning software or full ERP modules. It offers a flexible and accessible way to structure production decisions.
What causes capacity planning errors in Excel?
Common errors appear when teams rely on optimistic assumptions, outdated standard times, incomplete downtime data, or a capacity model that ignores real losses such as changeovers, micro-stoppages, absences, and maintenance interventions.
Who can use a production capacity planning template in Excel?
This kind of spreadsheet is useful for production managers, planners, supervisors, industrial engineers, operations coordinators, and students learning production control. It turns scattered operational data into a more structured planning view.
Modern industrial operations demand more than reactive maintenance; they rely on consistent performance and reduced downtime. Maintenance today is about