⚙️ OEE for Maintenance: Excel-based OEE calculator
In any manufacturing environment, machines must operate successfully, with reduced downtime, consistent output, and almost perfect quality. That is where OEE – Overall Equipment Effectiveness – becomes pivotal.
OEE is not merely a number, rather a reality check on how well assets are actually performing and more importantly, how they can improve.
What Is OEE, Simply Put?
OEE reveals how close equipment functions at full capacity.
OEE = Availability × Performance × Quality
Each factor centers on a specific part of production:
- Availability – Is equipment operational when expected?
- Performance – Is it functioning at the predicted speed?
- Quality – Is it creating quality parts with minimal waste?
Multiplying the percentages provides the OEE score — a singular value displaying a machine or production line’s effectiveness.
🔍 Breaking Down the Formula
Availability
This calculates the percentage of scheduled time equipment actually runs.
Availability = Operational Time ÷ Planned Production Time
If the shift is 8 hours and a machine is nonfunctional for 1 hour:
(7 ÷ 8) = 87.5%
Performance
Even when running, is it at the designed speed?
Performance = (Ideal Cycle Time × Total Count) ÷ Operational Time
If intended to make 100 units per hour but only 80, performance is lacking.
Quality
How much output meets standards?
Quality = Conforming Count ÷ Total Count
If ten out of each one hundred components necessitate rework or scrap, your caliber is solely ninety percent.
🧮 Aligning Everything Mutually
Let’s claim:
- Readiness = 90%
- Effectiveness = 85%
- Quality = 95%
Your OEE might be:
0.90 × 0.85 × 0.95 = 72.6%
That’s your realistic usefulness — and it’s lower than you might hope from tools that “are apparently performing nicely.”
The Reason Why OEE Matters for Maintenance Teams
Whereas production usually leads OEE conversations, maintenance plays a crucial function in each component of the rating:
- Unforeseen downtime impacts availability
- Worn-out elements or skipped inspections slow effectiveness
- Harmful calibration or maintenance neglect can result in quality points
Maintenance shouldn’t be just about fixing assets after they break — it’s about keeping performance optimized across the board.
How to Improve OEE Through Maintenance
Here are ways maintenance teams can immediately affect OEE:
✔️ Decrease Unforeseen Downtime
Carry out a robust preventive maintenance plan. Monitor MTBF and MTTR to spot gear getting unreliable.
✔️ Fine-Tune Equipment Effectiveness
Calibrate machines routinely. Keep an eye on abnormal vibration, heat, or pressure — all signs of a system falling out of spec.
✔️ Support Quality Output
Misaligned tools, dull cutters, or contaminated lines lead to defects. Routine checks can deter quality losses before they start.
Use OEE as a Diagnostic Tool
OEE isn’t merely a goal metric — it’s a conversation starter. If your score drops, ask:
- Is the issue mechanical, or is it operational?
- Is a single machine dragging down the entire line?
- Are we prioritizing maintenance where it matters most?
Used wisely, OEE helps maintenance teams focus their efforts and justify investment in tools, training, or spare parts.
What’s a “Good” OEE?
- 85% and above = World-class (uncommon, but possible)
- 60–85% = Solid, but improvable
- Below 60% = You’re leaving serious value on the floor
Every plant differs in its complexity and uniqueness, but the key remains consistently understanding your baseline and enhancing over time through adaptation and innovation.
📊 OEE Dashboard Excel Template
This tool provides maintenance and production teams with a simple yet powerful way to monitor and improve the performance of individual machines or production lines using the three core OEE components: Availability, Performance, and Quality.
Sheet Structure and Features
🟦 1. Title Header
- Located at the top of the sheet, merged across all columns.
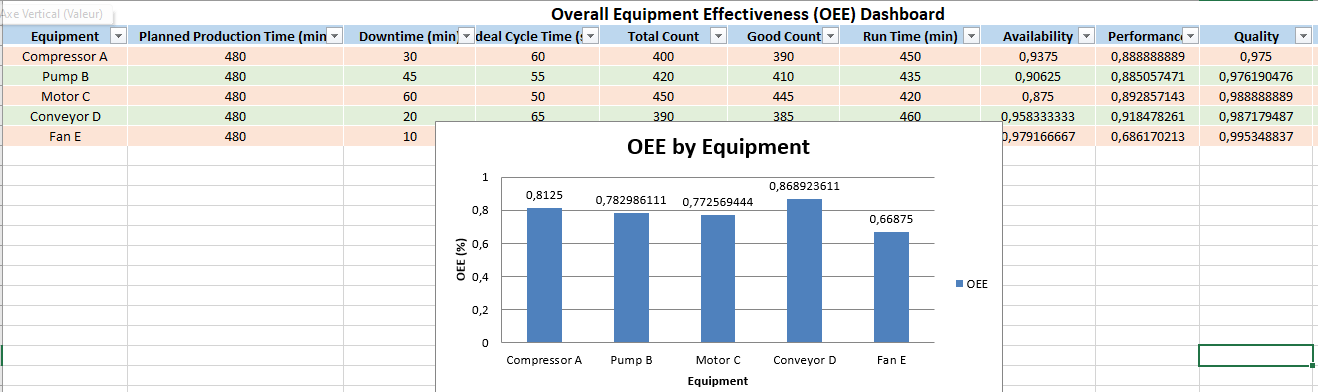
- Labeled: “Overall Equipment Effectiveness (OEE) Dashboard”
- Bold, center-aligned font for easy visibility.
🗂️ 2. Input Table
This structured and color-coded table allows users to input raw performance data for each piece of equipment.
Columns include:
| Column | Description |
|---|---|
| Equipment | Name of the asset (e.g., Pump B, Motor C) |
| Planned Production Time | Total scheduled time for production (in minutes) |
| Downtime | Unplanned downtime (in minutes) |
| Ideal Cycle Time | Expected time per unit (in seconds) |
| Total Count | Number of units produced |
| Good Count | Number of units that passed quality inspection |
🧩 This section uses Excel’s table format with alternating row colors (green/orange) and filters applied for sorting/searching.
🧮 3. Auto-Calculated Metrics
These columns are automatically calculated:
| Column | Formula |
|---|---|
| Run Time | = Planned Time – Downtime |
| Availability | = Run Time ÷ Planned Time |
| Performance | = (Ideal Cycle Time × Total Count ÷ 60) ÷ Run Time |
| Quality | = Good Count ÷ Total Count |
| OEE | = Availability × Performance × Quality |
📌 All formulas are embedded. When new equipment data is added, calculations update automatically.
Dynamic Chart: OEE by Equipment
- A bar chart displays the OEE score for each machine.
- Auto-updates as you change or add new equipment data.
- Labels show precise OEE percentages.
- Positioned to the right side of the data table for clear visual comparison.
Interactive Features
- ✅ Filterable table: Quickly narrow down by machine name, date, or performance
- 🪛 Customizable: Add more rows or machines — the chart and formulas will adjust accordingly
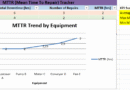
- 📊 Trend-ready: Data can be extended into a second sheet for time-based tracking or monthly trends
Ideal Use Cases
- Routine OEE reporting and monitoring by maintenance/production
- Decision support for identifying poor-performing equipment
- Justifying preventive maintenance or replacement investment
- Operator coaching and process improvement initiatives
🔍 Practical Cases of OEE in Maintenance + Optimization Tactics
🛠️ Case 1: Chronic Downtime on a Packaging Line
Scenario:
A food packaging line has an OEE score of 58%. Most of the loss is due to frequent unplanned stops—belt jams and sensor faults.
Diagnosis:
- Availability loss due to small, frequent failures.
- Technicians take too long to troubleshoot because the documentation is outdated.
Optimization Steps:
- Implement Preventive Maintenance (PM) checks on sensors and belts.
- Create standard fault resolution guides and place them near the machine.
- Use condition monitoring (e.g., photo-eye misalignment alerts) to prevent recurring issues.
Outcome:
Availability improves from 75% to 90%. OEE climbs to 70% without any new equipment investment.
⚡ Case 2: Underperforming Injection Molding Machines
Scenario:
An automotive supplier notices its OEE for two injection machines is stuck at 65%, mostly due to slow cycle times.
Diagnosis:
- Performance loss from poorly calibrated temperature and pressure settings.
- Operators running machines at lower speeds to “avoid scrap,” thinking they’re helping.
Optimization Steps:
- Recalibrate machines to optimal cycle times using manufacturer specs.
- Retrain operators with data-driven performance benchmarks.
- Introduce real-time dashboards to show live cycle speed vs. target.
Outcome:
Performance improves by 12%. With no increase in defects, OEE reaches 78%.
🎯 Case 3: Quality Losses in a Filling Station
Scenario:
A beverage company sees consistent output volumes but notices 9% of bottles don’t meet weight requirements, dragging OEE down.
Diagnosis:
- Quality losses caused by inconsistent fill heads and worn seals.
- Quality checks are only done every 30 minutes, letting too many bad units pass.
Optimization Steps:
- Tighten preventive maintenance schedules for fill head calibration and sealing gaskets.
- Move to inline automatic weight checks every 5 minutes instead of 30.
- Tag defective batches in the CMMS to trace recurring issues.
Outcome:
Scrap drops from 9% to 3%. Quality score jumps, pushing OEE from 66% to over 80%.
🧮 Case 4: OEE Used to Justify Equipment Replacement
Scenario:
One palletizer consistently shows an OEE of just 42%. It runs slowly (Performance), jams often (Availability), and causes packaging damage (Quality).
Diagnosis:
- The machine is 18 years old and no longer supports OEM parts.
- Maintenance hours are triple those of other palletizers.
Optimization Step:
- Compile OEE trends with cost of downtime and repair logs.
- Present data to leadership to justify capital expenditure.
Outcome:
A new palletizer is installed. Within 3 months, OEE for that line rises to 85%, reducing product loss and overtime.
Tips for OEE Optimization via Maintenance
| Area | Action Item | Tool/Strategy |
|---|---|---|
| Availability | Reduce breakdowns | Preventive/condition-based maintenance |
| Performance | Eliminate slowdowns | Operator training, cycle time audits |
| Quality | Reduce defects | Root cause analysis, tool calibration |
| Visibility | Highlight issues early | Use of dashboards and trend charts |
| Decision-Making | Prioritize investments | Use historical OEE + cost reports |
📘 Bonus Insight: OEE is Maintenance’s Scorecard
By tracking OEE over time and by machine, maintenance teams can:
- Show the business case for staffing or upgrades
- Direct efforts where they’ll have the biggest impact
- Bridge communication with production and quality teams using shared data
🔧 The Bottom Line
OEE connects the dots between equipment condition, operator behaviors, and process proficiency. For maintenance crews, it provides both an assessment and a roadmap.
- Want higher availability? Concentrate on dependability.
- Desire augmented performance? Investigate calibration and lubrication protocols.
- Seek decreased defects? Collaborate with production on root cause examinations.
OEE helps maintenance teams work effectively, not just actively — and proves that sustaining machinery properly is pivotal to business success.