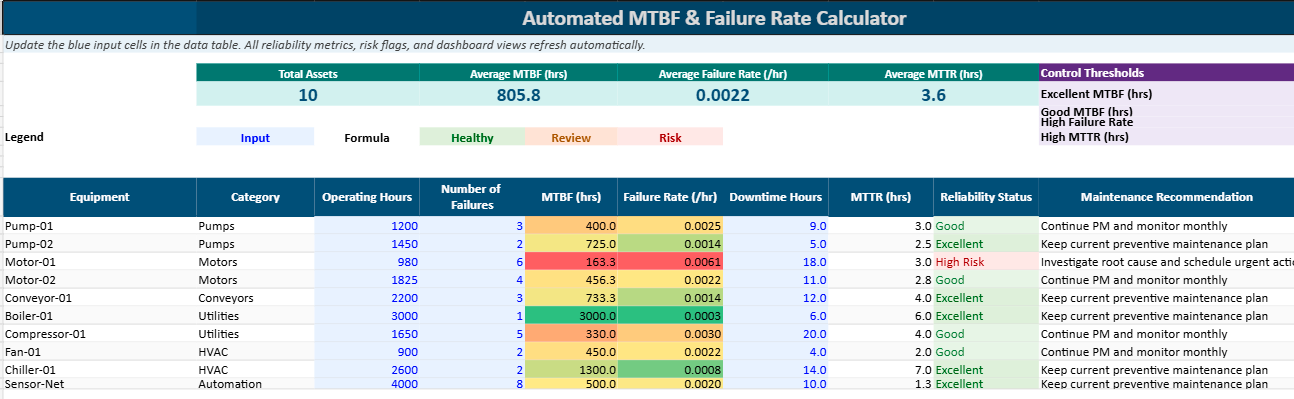
MTBF and Failure Rate Calculator in Excel
Recommandés
When a machine keeps running without trouble, most people hardly notice. The real attention comes the moment it stops. Production slows down, teams react quickly, schedules shift, and costs start building almost immediately. That is exactly why reliability matters so much in maintenance and operations.
Among the indicators used to understand equipment performance, MTBF and failure rate remain two of the most useful. They may look technical at first, yet the idea behind them is actually simple. They help answer a very practical question: how often does a machine fail, and how long does it usually run before the next breakdown happens?
For maintenance teams, engineers, technicians, plant managers, and even students learning the basics of reliability, these two indicators offer a clearer view of what is really happening on the ground. They turn scattered breakdown data into something meaningful, something that can support better planning and better decisions.
This guide explains what MTBF is, how failure rate works, how both are calculated, and how they can be tracked easily in Excel.
What MTBF Really Means
MTBF stands for Mean Time Between Failures. In simple terms, it measures the average amount of operating time between one failure and the next for a repairable system.
That definition sounds technical, yet the idea is very concrete. Imagine a machine that runs for a certain number of hours over a period of time and breaks down several times along the way. MTBF helps you estimate the average number of hours that pass between those failures.
It is usually expressed in hours, and it is widely used in maintenance, manufacturing, industrial engineering, utilities, transport, and many other fields where equipment availability matters.
A higher MTBF usually suggests that the equipment is more reliable. A lower MTBF often points to repeated problems, unstable performance, or a need for closer attention.
Why MTBF Matters in Real Life
MTBF is not just a number that sits in a report. It has real value in daily operations.
When a team knows how long a machine typically runs before failing, maintenance becomes less reactive. Instead of waiting for the next stoppage, they can start planning ahead. That changes everything. It improves scheduling, reduces emergency interventions, and gives teams more control over their workload.
MTBF also makes it easier to compare equipment. Two machines may appear similar on the surface, yet one may fail far more often than the other. Without a reliability indicator, that difference may remain vague. With MTBF, it becomes measurable.
There is also a financial side to it. Frequent breakdowns rarely affect only the maintenance department. They often bring lost production time, delayed deliveries, overtime, and extra stress across the organization. Looking at MTBF helps reveal whether those disruptions are isolated incidents or signs of a deeper reliability problem.
Over time, MTBF can also support bigger decisions. When a machine keeps showing a weak reliability pattern, the issue may no longer be about maintenance alone. It may become a question of replacement, redesign, or process improvement.
The MTBF Formula
The formula itself is very simple:
MTBF = Total Operating Time / Number of Failures
That means you take the total amount of time the equipment has been running and divide it by the number of breakdowns recorded during that same period.
Example
Let us say a machine runs for 1,000 hours and experiences 5 failures.
MTBF = 1,000 / 5 = 200 hours
This means that, on average, the machine operates for 200 hours between failures.
That does not mean a failure will happen exactly every 200 hours. Real life rarely works with that kind of precision. The figure simply gives an average based on the data collected.
What Failure Rate Means
The failure rate looks at the same reality from the opposite angle. Instead of asking how long equipment runs between failures, it asks how frequently failures occur over time.
The formula is:
Failure Rate = 1 / MTBF
So if the MTBF is known, the failure rate can be calculated directly.
Example
If the MTBF is 200 hours, then:
Failure Rate = 1 / 200 = 0.005 failures per hour
This means that, on average, the machine experiences 0.005 failures for each hour of operation.
Some people prefer working with MTBF because it feels easier to picture time between failures. Others like failure rate because it reflects the frequency of problems more directly. In practice, both indicators complement each other well.
The Link Between MTBF and Failure Rate
These two indicators are closely connected.
When MTBF is high, equipment tends to run for longer stretches without interruption. That usually means the failure rate is low.
When MTBF is low, failures happen more often, so the failure rate becomes higher.
Looking at both together helps create a more balanced view. MTBF gives a sense of operational endurance, while failure rate gives a sense of how often breakdowns show up in the rhythm of production.
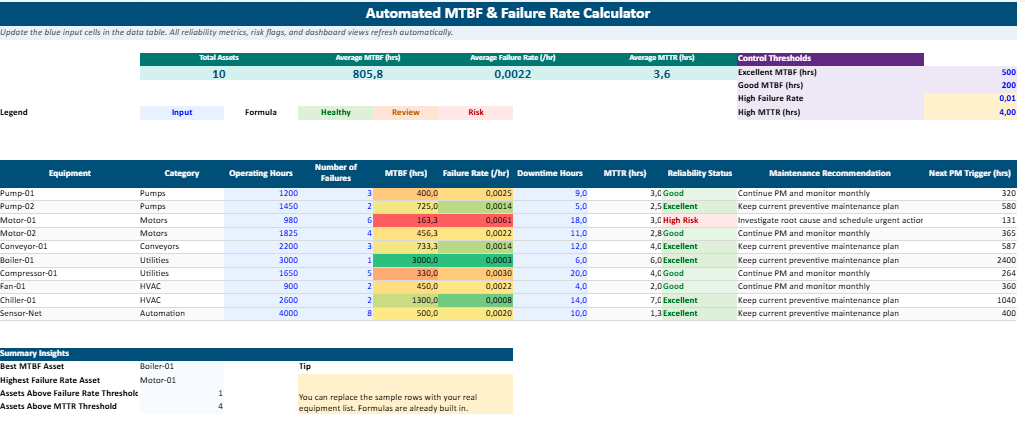
How to Calculate MTBF in Excel
Excel remains one of the easiest tools for tracking reliability indicators, especially for teams that want something practical and fast to update.
A simple spreadsheet can already provide useful visibility.
Step 1: Create a basic table
You can begin with columns such as:
| Equipment | Operating Time (hours) | Number of Failures |
|---|---|---|
| Machine A | 1000 | 5 |
| Machine B | 2500 | 10 |
| Machine C | 3000 | 6 |
Step 2: Add the MTBF formula
In a new column, calculate MTBF with a formula like this:
=B2/C2
Here:
- B2 contains the operating time
- C2 contains the number of failures
Step 3: Add the failure rate formula
In another column, use:
=1/D2
Here:
- D2 contains the MTBF result
Example of a completed table
| Equipment | Operating Time (hours) | Number of Failures | MTBF (hours) | Failure Rate |
|---|---|---|---|---|
| Machine A | 1000 | 5 | 200 | 0.005 |
| Machine B | 2500 | 10 | 250 | 0.004 |
| Machine C | 3000 | 6 | 500 | 0.002 |
This kind of table is simple, yet it already makes reliability tracking much easier. Once data is updated regularly, the sheet becomes a helpful monitoring tool rather than just a calculation file.
Practical Examples
Looking at several examples makes the concept easier to understand.
System A
- Operating time: 1,000 hours
- Failures: 5
MTBF = 1,000 / 5 = 200 hours
Failure Rate = 1 / 200 = 0.005 failures per hour
Machine B
- Operating time: 2,500 hours
- Failures: 10
MTBF = 2,500 / 10 = 250 hours
Failure Rate = 1 / 250 = 0.004 failures per hour
Equipment C
- Operating time: 3,000 hours
- Failures: 6
MTBF = 3,000 / 6 = 500 hours
Failure Rate = 1 / 500 = 0.002 failures per hour
Device D
- Operating time: 1,500 hours
- Failures: 2
MTBF = 1,500 / 2 = 750 hours
Failure Rate = 1 / 750 = 0.00133 failures per hour
System E
- Operating time: 500 hours
- Failures: 25
MTBF = 500 / 25 = 20 hours
Failure Rate = 1 / 20 = 0.05 failures per hour
These examples show how quickly the picture changes from one asset to another. A machine with an MTBF of 750 hours inspires far more confidence than one that fails every 20 hours.
How to Read the Results
Calculating MTBF is one thing. Understanding what it tells you is where the real value begins.
A high MTBF usually points to equipment that runs for longer periods without interruption. That often suggests better reliability, fewer operational disruptions, and less maintenance pressure.
A low MTBF, on the other hand, suggests that failures are returning too often. This may be linked to wear, poor operating conditions, repeated misuse, weak components, or gaps in preventive maintenance.
A low failure rate usually confirms that the asset is performing steadily.
A high failure rate is often a warning sign. It suggests that something in the equipment, the environment, the workload, or the maintenance approach deserves closer review.
Numbers alone do not tell the whole story, but they often point very clearly toward where questions should begin.
How MTBF Helps in Maintenance Work
In practice, MTBF supports several important maintenance actions.
It helps teams schedule preventive interventions at more appropriate moments. It helps compare similar machines and identify which assets are consuming too much attention. It can also reveal whether repeated breakdowns are random or part of a pattern that deserves deeper investigation.
MTBF is often used in dashboards and maintenance reports because it brings reliability into a form that managers can follow over time. A rising MTBF may reflect real progress. A falling MTBF may indicate that performance is slipping, even before the situation becomes critical.
It also helps when thinking about spare parts and response planning. Equipment that fails often usually needs stronger preparation around replacement parts, technician availability, and intervention readiness.
MTBF and MTTR: Not the Same Thing
MTBF is often mentioned together with MTTR, which stands for Mean Time To Repair.
The two indicators are related, though they measure different things.
- MTBF tells you how long equipment runs before failing
- MTTR tells you how long it usually takes to repair the equipment once the failure has happened
A machine may fail rarely, which gives it a strong MTBF, yet every repair may take a long time. In that case, the asset is reliable, but still disruptive when it does go down.
Another machine may fail more often, though repairs are completed quickly. That can reduce the operational impact for a while, though it still raises questions about long-term reliability.
This is why many maintenance teams monitor both indicators together.
The Limits of MTBF
As useful as MTBF is, it should never be treated as a perfect prediction tool.
First, it is an average. It helps describe past behavior, though it does not tell you the exact moment the next breakdown will happen.
Second, it does not explain the cause of failures. It can show that equipment is failing too often, yet it cannot tell you whether the reason is wear, overload, human error, lubrication problems, poor-quality parts, or something else.
Third, MTBF works best when operating conditions remain fairly consistent. If production loads, environmental conditions, or maintenance quality shift significantly, comparisons may become less reliable.
Finally, MTBF does not include repair time. It only focuses on the interval between failures, not on the duration of the response.
That is why MTBF should be seen as a valuable indicator, though not the only one.
Good Practices for Using MTBF Well
To get useful insight from MTBF, data quality matters a great deal.
Failures should be recorded carefully and consistently. Operating time should be defined clearly. Teams should work with comparable periods and avoid mixing very different usage conditions in the same calculation.
It also helps to read MTBF as a trend, not just as an isolated number. A single result gives a snapshot. A series of results over weeks or months tells a much more meaningful story.
Most importantly, MTBF becomes even stronger when it is read alongside other indicators such as:
- MTTR
- availability
- downtime
- intervention frequency
- recurring fault types
That broader view gives reliability analysis more depth and makes maintenance decisions more grounded.
FAQ MTBF and Failure Rate Calculator in Excel
Questions fréquentes pour mieux comprendre le calcul du MTBF, du taux de défaillance et leur utilisation concrète dans Excel pour le suivi maintenance.
What is MTBF in Excel and why is it useful for maintenance teams?
MTBF means Mean Time Between Failures. In Excel, it is used to calculate the average operating time between one breakdown and the next for a repairable asset. This helps maintenance teams track equipment reliability, compare machines, and spot assets that require closer attention.
How do you calculate MTBF in Excel?
The formula is simple: divide the total operating time by the number of failures. In Excel, a typical formula looks like:
=B2/C2
where B2 contains operating hours and C2 contains the number of failures.
What is the failure rate formula in Excel?
Failure rate is often calculated as the inverse of MTBF. If the MTBF result is in cell D2, the Excel formula can be:
=1/D2
This gives the average number of failures per hour of operation.
What is the difference between MTBF and failure rate?
MTBF shows how long equipment runs on average before failing. Failure rate shows how often failures happen over time. Both indicators describe the same reliability reality from two different angles, which makes them very useful when read together.
Is a high MTBF always a good sign?
In most cases, yes. A high MTBF usually suggests that equipment can operate for longer periods without interruption. Still, it should be interpreted with context, because MTBF alone does not explain the root cause of failures or the time required for repairs.
What does a low MTBF mean for a machine?
A low MTBF often means the machine is failing too frequently. This may indicate wear, repeated misuse, poor operating conditions, weak components, or gaps in preventive maintenance. It is usually a signal that the asset deserves closer review.
Can Excel be used to monitor MTBF for several machines at once?
Yes. Excel is well suited for building a simple reliability table with columns such as equipment name, operating time, number of failures, MTBF, and failure rate. Once updated regularly, the sheet becomes a practical monitoring tool for several assets.
What data do you need before calculating MTBF in Excel?
You need at least two values: total operating time and the number of failures recorded during the same period. The more accurate the maintenance log is, the more meaningful the MTBF result will be.
Can MTBF be calculated for non-repairable equipment?
MTBF is mainly used for repairable systems. For non-repairable items, other indicators are generally more appropriate, such as MTTF, which focuses on mean time to failure rather than time between repeated failures.
What is the difference between MTBF and MTTR?
MTBF measures how long equipment runs before a failure occurs. MTTR, or Mean Time To Repair, measures how long it usually takes to restore the equipment after the breakdown. One looks at reliability, the other at repair efficiency.
Why should MTBF and MTTR be tracked together in Excel?
Because they complete each other. A machine may fail rarely but take a long time to repair, or fail more often but return to service quickly. Tracking both indicators in the same Excel file gives a more realistic view of operational performance.
Can a maintenance dashboard include MTBF and failure rate KPIs?
Yes. These indicators are often used in dashboards because they turn maintenance history into readable KPIs. Over time, a rising MTBF may show improving reliability, while a rising failure rate may reveal a growing operational risk.
What are the limits of MTBF analysis?
MTBF is an average, not an exact prediction. It cannot tell you the exact date of the next failure, and it does not explain why the failure happened. It becomes much more useful when combined with maintenance history, operating context, downtime data, and fault analysis.
How often should MTBF data be updated in Excel?
It depends on the pace of operations, though many teams update it weekly or monthly. For critical equipment, more frequent updates can help detect a reliability decline earlier and support faster maintenance decisions.
Who can use an MTBF and failure rate calculator in Excel?
This kind of calculator is useful for maintenance technicians, industrial engineers, reliability teams, plant supervisors, production managers, and students learning maintenance KPIs. It turns raw breakdown data into practical indicators that are easier to read and explain.
Recommandés