Daily Production Report in Excel Free to Download: Purpose, Structure, and Implementation
A Daily Production Report (DPR) is a structured document used by manufacturing teams, supervisors, and plant managers to record the performance of production lines on a day-to-day basis. It serves as a factual record of what has been produced, how efficiently, and under what conditions. Unlike summaries generated at the end of a month or quarter, the daily report is focused on granular, shift-by-shift data that can guide immediate operational decisions.
Purpose of a Daily Production Report
The main purpose of a daily production report is to provide visibility into the day’s activities. It allows teams to track:
- Total units produced
- Machine performance
- Downtime events
- Quality control metrics
- Labor shifts
- Operational anomalies
This kind of tracking helps organizations monitor output, identify inefficiencies early, and maintain a consistent standard of documentation across different shifts and departments.
Core Components of the Report
A well-designed DPR typically includes the following fields:
- Date and Shift
To segment data by time and manage shift transitions effectively. - Machine or Line ID
Identifies the equipment involved in production. - Product Type
Tracks which items were produced during the recorded shift. - Units Produced and Defective Units
Helps measure total output and quality performance. - Downtime (in minutes)
Notes periods when machines were not operational, with reasons if known. - Efficiency, Yield, and Utilization Rates
These key performance indicators (KPIs) reflect the ratio of productive time and output to capacity and input. - Remarks or Issues Noted
Provides room for supervisors to document irregularities, delays, or recommended corrective actions. - Supervisor Notes Section
A space for personalized reporting on issues observed, workforce behavior, safety events, or other remarks.
Why the DPR Matters
Consistently completing a daily production report enables data-driven decision-making. Operations managers use these reports to assess whether production goals were met, identify emerging problems, and prioritize maintenance or quality improvements. For quality assurance teams, this report can provide early signals of recurring product defects or deviations from process standards. Additionally, DPRs are often reviewed during daily meetings and form part of long-term performance evaluations.
Best Practices for Using DPRs Effectively
- Use standardized templates
A consistent format helps maintain clarity, avoid omissions, and support comparative analysis. - Incorporate automation
Using Excel or digital reporting systems can reduce manual errors and enable real-time calculations. - Encourage detailed supervisor notes
Structured fields like “Machine Issues” or “Action Taken” help transform raw numbers into actionable insights. - Audit periodically
Reviewing reports regularly ensures data accuracy and reinforces accountability.
A Daily Production Report is more than a routine form—it’s a vital document that reflects the integrity of a company’s operations. When used consistently, it enhances transparency, enables better planning, and supports continuous improvement across production environments. Whether implemented in a small factory or a multi-line industrial plant, the DPR plays a central role in aligning day-to-day operations with broader production goals.
Implementation Strategies: Rolling Out Daily Production Reports
Rolling out a daily production report system requires careful planning and team involvement. Whether introducing it in a new facility or upgrading from a manual process to a digital one, the following steps can help ensure effective adoption:
1. Define Clear Reporting Roles
Clarify who is responsible for filling out the report—line operators, shift supervisors, or floor managers. Each role should understand what data they are accountable for and by when it must be submitted.
2. Train the Team on Data Accuracy
Teams must be trained to enter numbers that reflect actual performance, not estimates or adjusted results. Reporting integrity is essential; decisions based on inaccurate reports may lead to poor outcomes.
3. Choose the Right Format
Start with a practical template—preferably digital. Excel-based reports allow automatic calculations of totals, averages, and KPIs. If multiple shifts use the same template, consider using dropdown menus and protected cells to minimize input errors.
4. Standardize Time and Product Tracking
Be consistent in how you log time (e.g., 24-hour vs. 12-hour formats) and how you name products or machines. Consistency supports trend analysis and simplifies auditing.
Digital Integration and Automation
Modern manufacturing environments are increasingly moving toward integrated production systems. Here’s how digital tools can enhance the Daily Production Report process:
Excel-Based Dashboards
Excel remains a powerful tool for teams needing flexibility. Conditional formatting, formula-based KPIs, and pivot tables allow quick summaries of daily performance. Templates can be shared across departments using cloud services.
ERP and MES Integration
Larger factories often connect their DPRs with Enterprise Resource Planning (ERP) or Manufacturing Execution Systems (MES). In such cases, reports pull real-time data directly from production sensors, machines, or operator consoles. This reduces the manual burden and increases reliability.
Mobile Input and Cloud Sync
Shift supervisors may prefer inputting data from tablets or mobile devices while on the floor. Integrating Excel with apps like Microsoft PowerApps or Google Sheets can allow real-time updates and immediate team visibility.
Practical Use Cases
Case 1: Identifying a Bottleneck
Over one week, DPRs revealed that a packaging line consistently had higher downtime than others. Upon review of the “Remarks” section, it was found that the same component was jamming every evening shift. Maintenance replaced the part and downtime dropped by 40%.
Case 2: Improving Yield
An electronics manufacturer used the Yield (%) KPI from their DPR to spot a sudden drop in a particular shift. The report noted that a new operator had started that day. Additional training was provided, and the yield returned to normal levels.
Case 3: Supporting Safety Improvements
Several daily reports logged unexpected stoppages due to safety switch activations. Investigation confirmed a faulty sensor on a conveyor. The issue was addressed before causing an injury.
Daily Production Report & Performance Summary Template in Excel
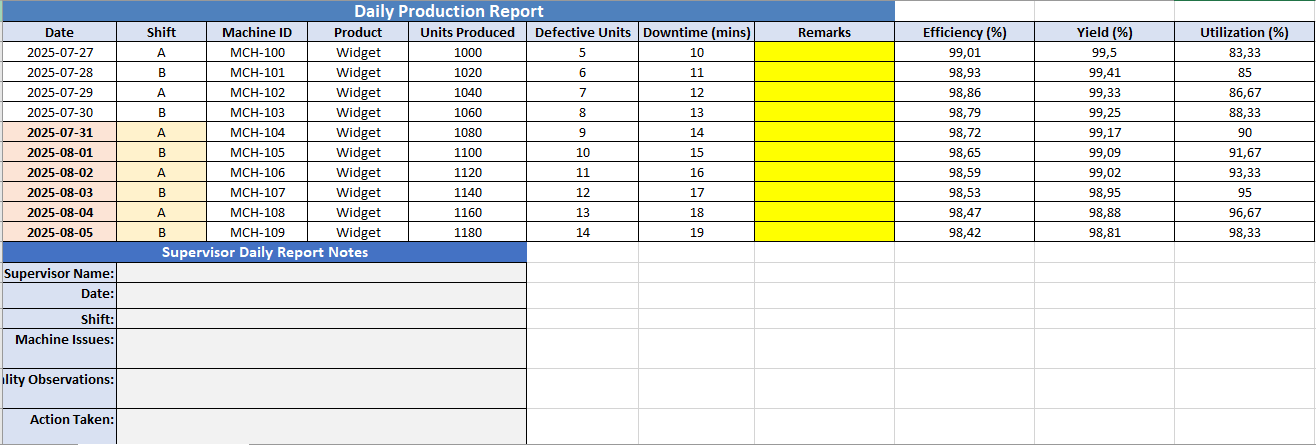
The Daily Production Report Excel sheet created for you is a fully structured, color-coded, and professionally formatted template designed to capture and summarize daily production operations. Here’s a detailed breakdown of its components:
🧾 Sheet Title
- Name:
Daily Production Report - Top Title Row: “Daily Production Report” (bold, white font on blue background, centered across columns A–K)
📊 Main Production Table
Columns Included:
- Date
- Shift
- Machine ID
- Product
- Units Produced
- Defective Units
- Downtime (mins)
- Remarks
- Efficiency (%) – (calculated as units produced relative to total time, adjusted for downtime)
- Yield (%) – (calculated as good units vs. total units)
- Utilization (%) – (ratio of actual production to theoretical max capacity)
Rows:
- 10 example entries (auto-filled with sample data)
- All rows formatted with borders, centered text, and conditional layout
🧮 Summary Section (Under Main Table)
Located around rows 7–12:
- Total Units Produced
- Total Defective Units
- Total Downtime (mins)
- Average Units Produced
- Average Defective Units
- Average Downtime (mins)
Each summary line includes:
- Label in the left cell with bold font and light orange background
- Formula cell with results (light yellow background)
🗒️ Supervisor Report Canvas
Located around rows 20–26:
- Section titled: “Supervisor Daily Report Notes” (white text on blue background)
- Six labeled fields with merged cells for writing:
- Supervisor Name
- Date
- Shift
- Machine Issues
- Quality Observations
- Action Taken
Each label is on the left with a light blue background. Corresponding input fields are wide, gray-shaded areas formatted for typing or handwriting (if printed).
Daily Production Report Format in Excel
A Daily Production Report Format in Excel is a structured spreadsheet used to track and manage production activities on a per-day basis. It provides a practical and customizable tool for documenting operational data such as output volume, downtime, quality metrics, and shift performance. Using Excel for this purpose enables automation, easy editing, and built-in formulas to monitor key indicators.
Essential Components of the Excel Format
1. Header Section
- Title: “Daily Production Report”
- Date of Report
- Shift Identifier
- Supervisor Name
2. Production Data Table
| Column | Description |
|---|---|
| Date | The actual date of the production |
| Shift | Shift code or name (e.g., A, B, C) |
| Machine ID | Unique identifier of equipment |
| Product | Product name or SKU |
| Units Produced | Number of items completed |
| Defective Units | Number of rejected items |
| Downtime (mins) | Total machine downtime |
| Efficiency (%) | Output adjusted for downtime |
| Yield (%) | Ratio of good units to total units |
| Utilization (%) | Machine use against full capacity |
| Remarks | Notes on any issues or highlights |
3. Summary Section
- Total Units Produced
- Total Defective Units
- Total Downtime
- Average Efficiency, Yield, and Utilization
4. Supervisor Notes
A canvas area for writing:
- Observations
- Machine issues
- Quality feedback
- Action taken or follow-ups
Benefits of Using Excel Format
- Customizable Fields: Easily adjust to specific products, machines, or factory setups.
- Automatic Calculations: Built-in formulas compute totals, averages, and KPIs.
- Visual Clarity: Conditional formatting can highlight issues or trends.
- Printable: Excel’s layout makes the report suitable for both digital and printed formats.
- Data Storage: Reports can be archived for audits or performance tracking.
Who Uses It
- Production Supervisors – to record shift activity
- Operations Managers – for reviewing daily performance
- Quality Control Teams – for defect tracking and feedback
- Maintenance Teams – to monitor machine downtimes
An Excel-based Daily Production Report format helps create consistent, accurate, and actionable records of daily manufacturing operations. Whether used in small workshops or large factories, it improves accountability and supports continuous improvement.