Weekly Production Planning in Excel for Industrial Team Management
Recommandés
In an industrial environment, production rarely depends on machinery alone. Performance is built through coordination: the right people, at the right workstation, at the right time, with clear priorities and enough visibility to keep the week under control. That is precisely where a weekly production plan becomes indispensable.
Far from being a simple scheduling sheet, a well-structured weekly production planning file in Excel can serve as a genuine operational command center. It helps supervisors distribute workloads, align teams with production targets, anticipate bottlenecks, and monitor execution with far greater clarity. When handled properly, it turns routine planning into a strategic management practice.
Why Weekly Production Planning Matters on the Shop Floor
Industrial operations move quickly, yet they also depend on structure. A weekly planning horizon offers a practical balance between long-range targets and day-to-day realities. It gives production managers enough visibility to organize labor and equipment efficiently, while preserving the flexibility required to respond to breakdowns, absences, changeovers, urgent orders, or quality-related issues.
This weekly view supports better decision-making across the production chain. It allows teams to see where resources are committed, where workloads are heavy, and where adjustments may be required before small inefficiencies grow into larger disruptions.
More importantly, it creates a shared operational language. Supervisors, planners, team leaders, and operators can all work from the same framework, with the same priorities and the same understanding of what must be achieved during the week.
More Than a Schedule: A Tool for Industrial Coordination
A weekly production plan should do more than display tasks across a calendar grid. Its real value lies in its ability to connect planning with execution.
A strong Excel planning model can support several essential functions at once:
- organizing operations by day, shift, team, or workstation
- assigning responsibilities clearly
- tracking planned versus actual output
- measuring deviations in real time
- identifying pressure points before they affect delivery performance
- supporting coordination between production, maintenance, logistics, and quality teams
This broader role is what transforms a spreadsheet into a working management instrument. The most effective files are not overloaded with complexity. They are structured, readable, and designed to support decisions quickly.
What a Well-Built Weekly Production Planning File Should Include
For a weekly planning file to be genuinely useful in an industrial context, it needs a clear operational structure. Every line should provide enough information to guide execution while remaining easy to update during the week.
A solid layout usually includes the following elements:
| Field | Purpose |
|---|---|
| Date / Day | Organizes activities across the week |
| Workstation or Line | Identifies where the operation takes place |
| Planned Operation | Specifies the type of task to be performed |
| Assigned Team | Shows which group is responsible |
| Start Time / End Time | Frames the task within the shift |
| Planned Duration | Measures expected time allocation |
| Planned Quantity | Sets the production target |
| Actual Quantity | Captures the result after execution |
| Variance | Highlights gaps between expectation and reality |
| Validation Status | Confirms completion or pending review |
This type of structure creates immediate visibility. A production manager can identify overloaded slots, compare team performance, or detect where planned output is slipping, all without waiting for a separate report.
Excel as a Practical Industrial Planning Solution
Excel remains widely used in industrial settings because it is flexible, accessible, and fast to adapt. For many workshops and production units, it offers the right level of control without requiring the heavy implementation of larger software systems.
A carefully designed Excel template can include:
- automatic duration calculations
- productivity ratios
- planned-versus-actual comparisons
- validation checkboxes
- filters by team, operation, or workstation
- summary dashboards with charts and performance indicators
This makes Excel particularly useful for organizations that want a responsive planning tool without losing control over customization. It is also a strong option for companies operating between manual management and more advanced digital manufacturing systems.
In many cases, Excel becomes the bridge between operational practicality and structured performance monitoring.
The Human Dimension of Weekly Production Planning
Production planning is often discussed in technical terms, yet its human dimension is just as important. Behind every production target is a team, and behind every planning decision is a workload that affects people directly.
A weekly production plan helps bring greater fairness and consistency to team management. It allows supervisors to distribute work more evenly, check working hours, anticipate overtime pressure, and ensure that shift rotation remains manageable.
This is particularly useful in environments with:
- multi-shift systems
- rotating teams
- skill-based workstation assignments
- fluctuating demand
- temporary labor or replacement staffing
When the planning file includes operator availability, team allocation, and real execution times, it becomes a valuable support tool not only for production but also for HR-related monitoring. It can help document activity, clarify responsibilities, and create a more transparent view of how work is actually organized during the week.
Turning Planning Data into Operational Insight
The strongest weekly planning files do not stop at data entry. They generate insight.
Once actual output is recorded, the file can reveal patterns that would otherwise remain hidden. A team may consistently underperform on a specific operation. A workstation may show strong output on one shift and weaker performance on another. Certain tasks may consume more time than originally planned week after week.
This analytical layer is where planning begins to support continuous improvement.
Useful indicators extracted from a weekly production planning file may include:
- average output per hour by workstation
- completion rate by team
- percentage variance between planned and actual quantity
- validation rate of scheduled tasks
- workload distribution by day
- total hours planned versus total hours actually used
These measures help managers move beyond intuition. They make discussions more precise during production meetings and support better decisions about staffing, sequencing, maintenance, and workload balancing.
Key Industrial Calculations Behind the Weekly Plan
A professional production planning model is strengthened by reliable operational calculations. These formulas help convert the schedule into something measurable and actionable.
1. Task duration
The first essential calculation is the time allocated to each operation.
Excel formula:= (End Time - Start Time) * 24
This returns the duration in hours and gives immediate visibility on workstation occupation.
2. Production variance
One of the most useful indicators in weekly follow-up is the variance between what was planned and what was actually produced.
Excel formula:= (Actual Quantity - Planned Quantity) / Planned Quantity
This reveals overperformance or underperformance as a percentage and helps identify where corrective action may be needed.
3. Output rate
A simple but powerful productivity indicator can be calculated by dividing actual production by actual time spent.
Formula:Actual Quantity / Actual Duration
This gives a rate in units per hour and can be compared by workstation, by team, or by day.
4. Net production capacity
A weekly schedule also becomes more realistic when it reflects true available capacity.
Net capacity = Gross available time – planned downtime – breaks – known interruptions
This prevents overloading the plan with unrealistic expectations and makes scheduling more credible from the outset.
Planning Criteria That Shape Industrial Reality
A production plan is never built on targets alone. It must also reflect the constraints that define real industrial work.
Among the most important criteria are:
Technical constraints
Machine availability, setup time, line speed, maintenance windows, and workstation specialization all shape how the week can be organized.
Workforce constraints
Skill availability, legal working hours, team rotation, absences, and certification requirements influence who can be assigned where and when.
Production priorities
Urgent orders, customer deadlines, stock shortages, or critical production runs often determine what must be scheduled first.
Quality constraints
Inspection points, stabilization time, traceability needs, and process rules can affect sequencing and the timing of operations.
Logistics constraints
Material shortages, supplier delays, or dependency on upstream processes may force adjustments even when labor and equipment are available.
A planning file that ignores these realities quickly loses credibility. A useful one incorporates them as part of normal weekly management.
Why the Weekly Format Works So Well
The weekly format is especially effective because it is short enough to remain operational and long enough to support meaningful coordination.
A daily schedule can become too reactive. A monthly one often feels too distant from shop-floor realities. Weekly planning sits in the middle, which makes it ideal for industrial supervision.
It gives teams a practical rhythm. Managers can prepare the week, monitor progress as it unfolds, and review results before the next cycle begins. This repeated structure encourages discipline while keeping room for adaptation.
It also supports better communication. Team leaders can brief operators more clearly. Maintenance can anticipate intervention slots. Logistics can align deliveries more accurately. Quality teams can schedule checks with greater visibility.
From Spreadsheet to Management Dashboard
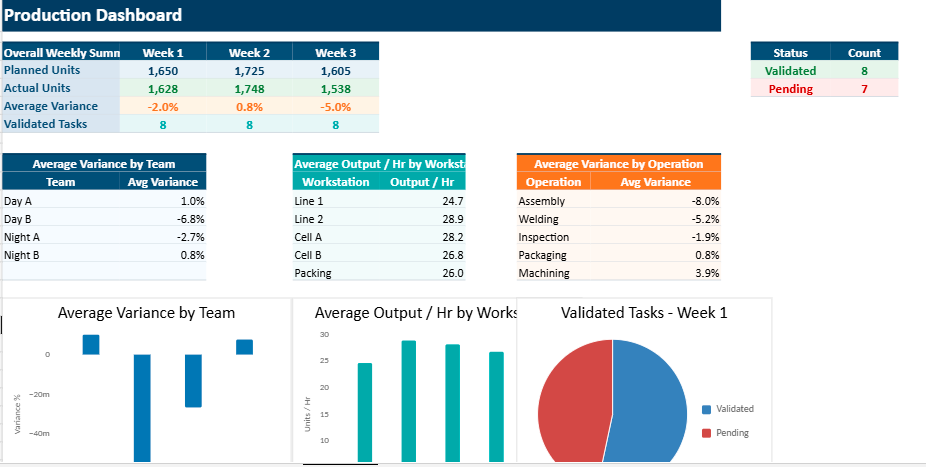
Once visual summaries are added, the planning file becomes more than an administrative support document. It becomes a dashboard.
Charts showing average variance by team, workstation, or operation make the week easier to read. Performance patterns appear more quickly. Problem areas stand out without requiring lengthy interpretation.
A simple dashboard may include:
- average variance by team
- average variance by workstation
- average variance by operation
- completion status of planned tasks
- distribution of production across the week
This visual layer strengthens managerial responsiveness. It makes the file more useful during briefings, review meetings, and operational follow-up.
A Practical Example of a Ready-to-Use Model
A strong weekly production planning workbook may include several weekly tabs, simulated production data, automatic formulas, and a centralized dashboard. This kind of file offers immediate usability while remaining easy to adapt to specific industrial contexts.
For example, a ready-to-use model might contain:
- Week 1, Week 2, and Week 3 sheets
- sample time slots and team assignments
- workstation-based activity tracking
- planned and actual quantity fields
- automated variance calculations
- summary charts for performance monitoring
Such a template can be used as-is, then gradually adjusted to match the structure of a plant, workshop, or production cell. Its simplicity is part of its strength. Operators and supervisors can work with it without needing advanced Excel expertise.
Weekly Production Planning as a Lever for Better Industrial Performance
At first glance, a weekly production planning file may look like a routine administrative document. In practice, it often becomes one of the most useful management tools in the industrial environment.
It clarifies priorities. It structures execution. It reveals performance gaps. It strengthens coordination across teams. It also creates a more disciplined rhythm for production management, one that is easier to follow, easier to measure, and easier to improve.
When Excel is used intelligently, weekly production planning becomes far more than a spreadsheet. It becomes a practical cockpit for industrial team leadership.
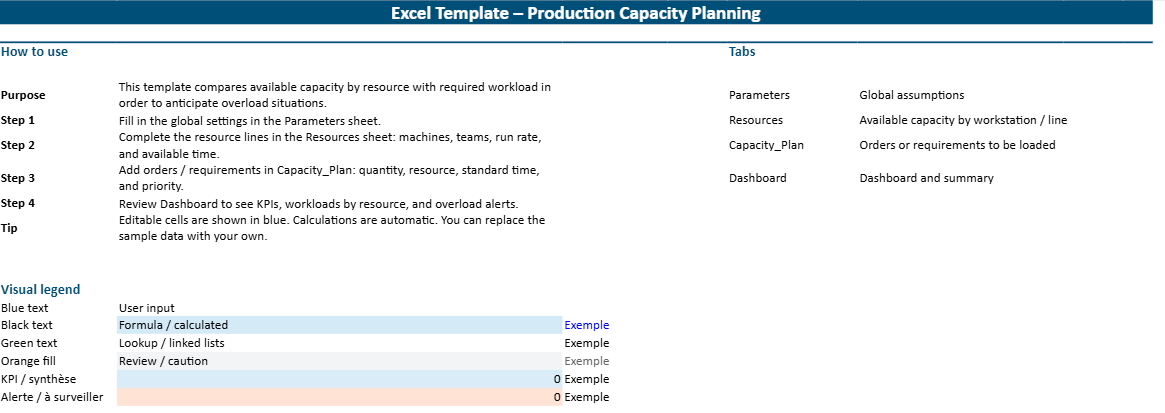
Weekly Production Planning Excel Template with Dashboard for Industrial Teams
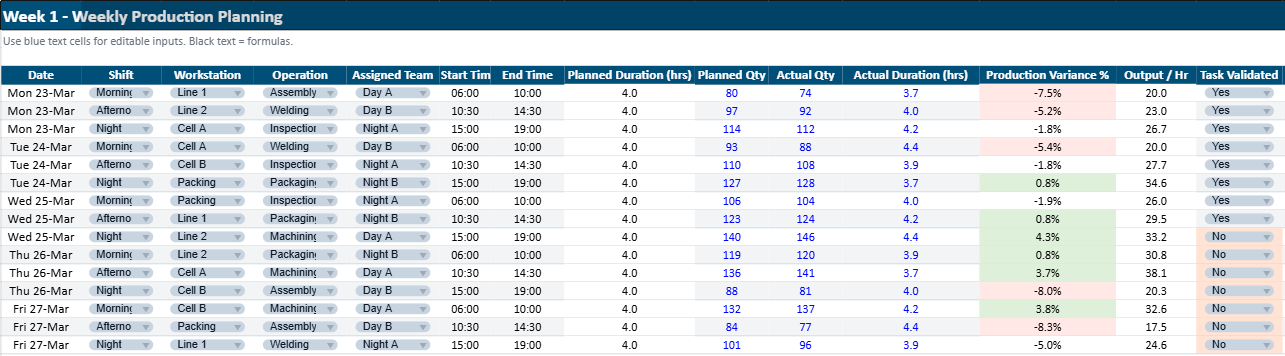
This Excel workbook is designed to make weekly production planning feel more straightforward and easier to manage. It gives production teams a simple way to organize the week, record what is scheduled, and check how actual results compare with what was originally planned.
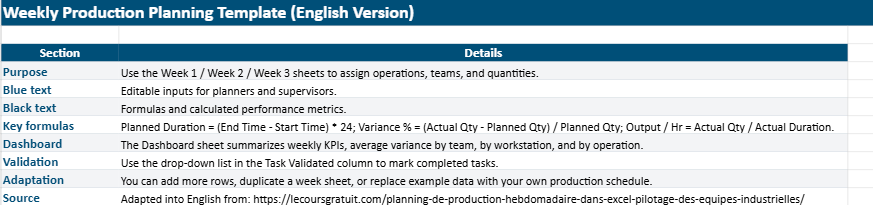
The workbook includes an Instructions sheet, three weekly planning sheets (Week 1, Week 2, and Week 3), and a Dashboard with key figures and charts. In the weekly sheets, you can enter the main production details, such as the date, workstation, operation, team, working hours, planned quantity, actual quantity, and completion status.
As the week progresses, the file helps you keep an eye on production by showing automatic calculations like duration and variance. The Dashboard brings everything together in a visual format, so it becomes easier to notice performance trends, delays, or gaps between the target and the actual output.
Brief Description
This workbook is a practical Excel tool for following weekly production in an industrial environment. It helps teams plan daily activities, assign work clearly, track production results, and review performance in one place. With its weekly sheets and visual dashboard, it gives supervisors and managers a clearer picture of how the week is unfolding and where adjustments may be needed.
FAQ – Weekly Production Planning in Excel
Practical answers for industrial teams using Excel to organize weekly production, monitor execution, and improve coordination on the shop floor.
What is a weekly production planning file in Excel?
A weekly production planning file in Excel is a structured workbook used to organize industrial activities across the week. It usually helps teams schedule operations by day or shift, assign workstations and teams, enter planned quantities, compare them with actual results, and follow completion status in one place.
Why is weekly production planning important in an industrial environment?
Weekly planning creates a practical balance between long-term targets and daily operational reality. It gives supervisors enough visibility to organize labor, machines, materials, and priorities while keeping enough flexibility to react to breakdowns, absences, urgent orders, or quality issues.
What should a good weekly production plan include?
A useful weekly production plan generally includes the date or day, workstation or line, operation name, assigned team, start time, end time, planned duration, planned quantity, actual quantity, variance, and validation or completion status. This structure makes execution easier to follow throughout the week.
How does Excel help with weekly production planning?
Excel remains popular because it is flexible, accessible, and fast to adapt. A well-built file can automate duration calculations, highlight production gaps, filter tasks by team or workstation, and display dashboard charts that make performance easier to read during the week.
What is the difference between planned quantity and actual quantity?
Planned quantity represents the production target set before execution. Actual quantity is the result recorded after the work has been completed. Comparing the two gives managers a clearer view of whether the team met expectations, fell behind, or exceeded the target.
How do you calculate task duration in Excel for a production plan?
Task duration is usually calculated from the start time and end time. In Excel, a common formula is:
This converts the time difference into hours and helps show how long each task occupies a workstation or team.
How do you calculate production variance in Excel?
Production variance measures the gap between what was planned and what was actually produced. A common Excel formula is:
The result is often shown as a percentage. It helps identify underperformance or overperformance quickly.
What KPIs can be tracked in a weekly production planning dashboard?
A dashboard can track average variance by team, variance by workstation, task completion rate, workload by day, average output per hour, planned hours versus actual hours, and overall production distribution across the week. These indicators make meetings more precise and more action-oriented.
Can a weekly production planning file help with team management?
Yes. A weekly planning file also supports team coordination by making workload distribution more visible. It can help supervisors manage shift assignments, check staffing availability, anticipate overtime pressure, and keep responsibilities clearer across teams and workstations.
What constraints should be considered when preparing a weekly production schedule?
A realistic weekly schedule should reflect machine availability, setup times, maintenance windows, labor skills, working-hour limits, absences, urgent orders, customer deadlines, inspection points, and material availability. A plan becomes useful when it reflects real operational conditions rather than ideal assumptions.
Why is the weekly format often better than daily or monthly planning?
The weekly format is often easier to manage because it is long enough to support coordination and short enough to remain operational. A daily plan can become too reactive, while a monthly schedule may feel too far from what really happens on the shop floor.
Who can use a weekly production planning Excel template?
This type of Excel template can be used by production supervisors, planners, workshop managers, team leaders, operations coordinators, and even maintenance or logistics staff who need a clearer picture of the production week and its constraints.
Recommandés