Excel-Based Machine Utilization Tracker: Formula for Measuring Performance
Download Machine Utilization Tracker (Excel)- Performance Measurement Formula ⬇️
In production environments, success isn’t just about how much gets done—it’s about how effectively equipment is used to do it. Machines represent some of the highest capital investments in manufacturing, which makes understanding their utilization a critical metric for any operations manager or plant supervisor.
Yet, many small to mid-size operations still don’t track it effectively. Sophisticated software solutions exist, but they often require more budget and integration than smaller teams can support. Fortunately, a well-structured Excel-based Machine Utilization Tracker can deliver reliable insights without the complexity.
What Is Machine Utilization?
Machine utilization measures how much of the available machine time is actually being used for production. It’s typically expressed as a percentage:
Utilization (%) = (Operating Time / Available Time) × 100
This simple formula can reveal a lot. If a machine is available for 8 hours a day but only runs for 5, it’s operating at about 62.5% utilization. Over time, these patterns help diagnose problems like excessive changeover times, unplanned maintenance, or workflow bottlenecks.
Inside the Excel Model
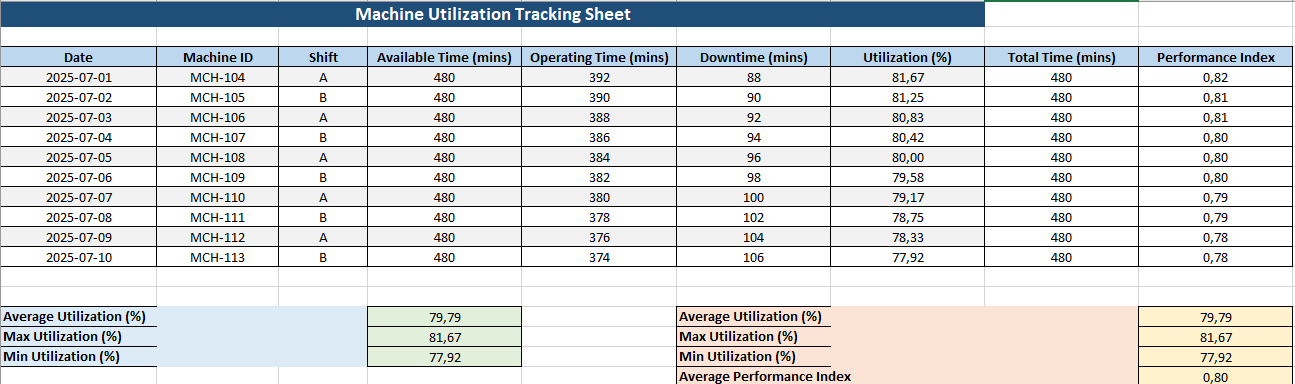
The Excel sheet designed here provides a structured and visual way to track utilization over days or weeks. It captures:
- Date, Machine ID, and Shift
To isolate performance across specific machines and working periods. - Available Time, Operating Time, and Downtime
Allowing users to see the full time picture and where losses occur. - Calculated Utilization (%)
Automatically computed using Excel formulas. - Total Time & Performance Index
The model also introduces a performance metric—Operating Time ÷ (Operating + Downtime)—giving a secondary view into efficiency beyond just availability. - Color-coded Summary Section
Includes average, max, and min utilization, as well as average performance index for quick analysis.
The layout is designed for daily input, print-friendly review, and easy customization.
Why It Works
This kind of Excel tracker works well because it doesn’t overwhelm users with unnecessary complexity. At the same time, it doesn’t sacrifice analytical depth. You can:
- Spot underperforming machines quickly
- Justify maintenance plans with downtime data
- Track performance over shifts, days, or operators
- Establish a baseline for continuous improvement
Even better, it fits right into existing workflows. Operators or supervisors can update it daily with a tablet, laptop, or printed sheet.
How to Use It
- Input Daily Values
At the end of each shift, enter the total available time (e.g., 480 minutes), how long the machine ran, and the downtime. - Review Summary Weekly
Use the summary at the bottom to identify trends and extremes. Is utilization improving? Is downtime creeping up? - Use the Data for Decisions
The spreadsheet doesn’t just record activity—it supports action. Adjust schedules, improve setups, or target maintenance based on real evidence.
This Excel tool provides a practical starting point for operations teams that want to track performance seriously but don’t yet need (or can’t yet afford) full-scale automation software.
If you’d like this sheet adapted to include shift comparisons, downtime reasons, or graphical dashboards, that can be built into the same framework. It’s designed to grow with your process.
⚙️ Implementing Machine Utilization Tracking: What to Watch For
Introducing machine utilization tracking can be done in a day, but integrating it into your workflow takes more than just a spreadsheet. It requires habit, consistency, and some cultural alignment on the shop floor. Below are a few points to consider when putting a system like this into practice.
1. Assign Responsibility
Designate who is expected to input the data. Typically, this falls on shift supervisors or line leads. When everyone assumes someone else is tracking, nothing gets tracked. Make it a routine task with a clear owner.
2. Stay Consistent with Time Reporting
Decide early whether you’re measuring in minutes or hours and stick to it. If one team reports in hours and another uses minutes, your averages and summary formulas will produce unreliable results.
3. Avoid Overcomplication
Don’t try to track everything at once. This model works best when focused on the basics: time available, time running, and time down. If too many data points are required from operators, they may skip entries or start estimating—weakening the usefulness of the data.
4. Use the Summary, Don’t Ignore It
The bottom section of the tracker calculates averages and performance indicators. It’s easy to overlook this, especially when you’re just focused on filling in numbers. But it’s often the most important part. These summaries reveal patterns that don’t show up in isolated rows.
Common Mistakes to Avoid
- Backfilling days: Filling out three or four days at once from memory leads to unreliable data.
- Guessing downtime: Time spent fixing a machine should be tracked with a stopwatch or estimate close to the moment—not hours later.
- Letting formulas break: If you insert rows or copy-paste badly, the utilization formula can become disconnected. Always double-check after edits.
Next Steps: Extending the Template
This Excel tracker can evolve as your needs grow. Here are some ideas for extensions:
📉 Add a Dashboard
Use Excel’s chart tools to create a weekly or monthly graph showing utilization trends per machine or shift. Visual summaries are much easier to digest in meetings than spreadsheets.
Include Downtime Reasons
Add a dropdown or column where the operator selects from downtime reasons: maintenance, material shortage, changeover, etc. This provides context behind the numbers.
📋 Link to Maintenance Logs
Machines with frequent low utilization may be due for maintenance. Link your utilization sheet to a preventive maintenance log to connect the dots.
- Tracking machine utilization is a gateway into deeper operational understanding. It turns your equipment from silent assets into measurable performers. And with a tool as accessible as Excel, there’s no need to wait for a full software rollout. You can start now—with the tools you already have.
- Machine utilization isn’t just about numbers—it’s about visibility. When you know exactly how your machines are performing, you can make smarter decisions, reduce waste, and increase output without buying a single new piece of equipment.
🔍 Breaking Down the Formulas in the Machine Utilization Tracker
When tracking machine performance, numbers alone aren’t helpful unless you understand where they come from and what they mean. Let’s walk through the key formulas used in the Excel sheet, line by line, so anyone using the file can read, trust, and explain the calculations.
🧮 1. Utilization (%)
Formula Used:
=IF(D4=0, 0, E4/D4*100)
✅ What It Does:
This formula calculates how much of the machine’s available time was actually used for production.
🔍 How It Works:
- D4 is the total available time (in minutes).
- E4 is the operating time (how long the machine was running).
- If D4 is 0 (to prevent division by zero), it returns 0.
- Otherwise, it divides E4 by D4 and multiplies by 100 to get a percentage.
📊 Example:
- If a machine was available for 480 minutes and operated for 420 minutes, the result would be:
= 420 / 480 * 100 = 87.5%
🧮 2. Total Time
Formula Used:
=E4 + F4
✅ What It Does:
Adds up the operating time and downtime to give the total time the machine was occupied—whether running or stopped.
🔍 How It Works:
- E4 is the time the machine ran.
- F4 is the downtime (mechanical failure, setup, etc.).
- Together, they represent the full time under observation.
📊 Example:
- If the machine ran for 400 minutes and was down for 80 minutes, total time = 480 minutes.
🧮 3. Performance Index
Formula Used:
=IF(H4=0, 0, E4/H4)
✅ What It Does:
Measures how well the machine performed during the time it was in use.
🔍 How It Works:
- H4 is total time (Operating Time + Downtime).
- E4 is still the operating time.
- This formula shows the ratio of productive time to total time.
Example:
- If total time was 480 minutes and operating time was 420 minutes:
= 420 / 480 = 0.875 (or 87.5% efficiency)
Summary: Why These Formulas Matter
| Metric | What It Tells You |
|---|---|
| Utilization % | How much of the available time was used |
| Total Time | The full time the machine was tracked |
| Performance Index | How much of that time was productive |
By combining these three, you get a complete picture—not just if the machine ran, but how efficiently and how often. It’s simple math, but it can power smarter decisions in scheduling, staffing, and maintenance planning.