OEE in Manufacturing Calculator in Excel: Easy OEE Tool & Dashboard
Measuring production performance should never feel complex. An OEE calculator in Excel offers a simple yet powerful way to transform raw production data into clear, actionable insights. By combining availability, performance, and quality into one dynamic view, this tool helps teams identify losses, monitor efficiency, and make faster, more informed decisions directly from a single, structured dashboard.
Manufacturing Performance
OEE in Manufacturing: A Clear, Practical Guide to Measuring What Truly Matters
Operational performance rarely fails for a single reason. Losses accumulate quietly — minutes of downtime here, a slight drop in speed there, a handful of defects at the end of the line. OEE, or Overall Equipment Effectiveness, brings those fragments together into one coherent picture.
Understanding OEE Beyond the Formula
OEE is often introduced as a percentage. That definition is technically correct, yet incomplete. What it really offers is a way to translate production reality into something measurable and comparable.
At its core, OEE answers a simple question: how much of the planned production time is truly productive?
The OEE Formula
OEE = Availability × Performance × Quality
The result represents the proportion of time during which equipment produces good parts, at the right speed, without interruption.
The Three Dimensions That Shape Performance
Availability
Measures how much scheduled production time equipment is actually running.
Performance
Compares actual production speed with the ideal cycle time.
Quality
Distinguishes total output from good, usable production.
Interpreting OEE Scores
OEE Score
Interpretation
Operational Meaning
Below 60%
Weak control
Frequent downtime, speed losses or quality issues.
60%–75%
Developing performance
The process works, but losses remain visible.
75%–85%
Strong control
Good operational stability with room for refinement.
Above 85%
World-class target
High efficiency, reliable equipment and controlled quality.
Why OEE Matters in Daily Operations
OEE aligns the language of operators, supervisors, maintenance teams and managers. Instead of debating impressions, teams can rely on a shared reading of losses: where time disappears, how speed deviates, and why defects occur.
This makes OEE more than a dashboard metric. Used properly, it becomes a practical tool for daily meetings, Lean routines, maintenance planning and continuous improvement.
Common OEE Pitfalls
Treating OEE as a reporting figure rather than an improvement tool.
Focusing on the final percentage while ignoring the causes behind it.
Collecting too much data and discouraging shop-floor adoption.
Comparing different processes without considering context.
Turning OEE Into Action
Each OEE component should lead to a specific response. Low availability points toward downtime, breakdowns or changeover problems. Weak performance suggests speed losses or process inefficiencies. Poor quality reveals defects, rework or upstream instability.
Availability loss
Investigate downtime, maintenance, setup and stoppages.
Performance loss
Review cycle time, micro-stops, operator flow and machine speed.
Quality loss
Analyze scrap, rework, defects and process variation.
OEE Within a Broader Lean System
OEE rarely works alone. It becomes stronger when combined with pull flow, Kanban, lead time analysis, preventive maintenance and visual management. Together, these methods turn isolated numbers into a coherent production system.
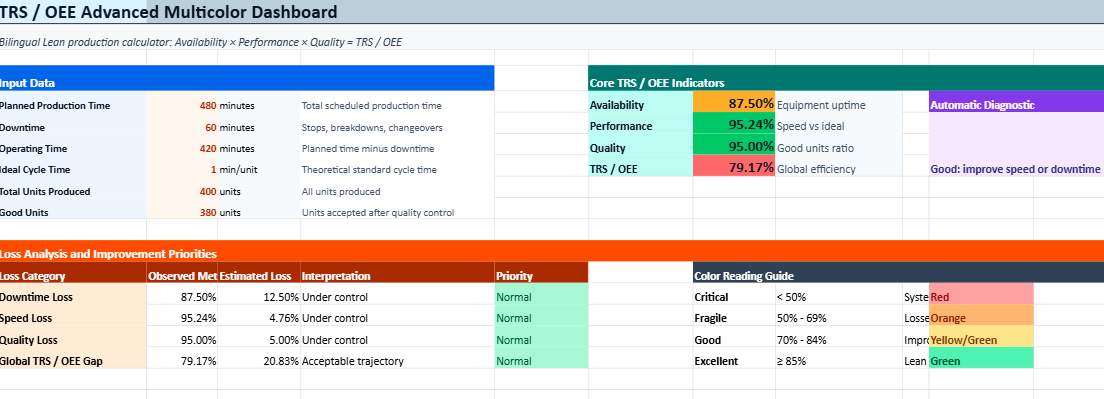
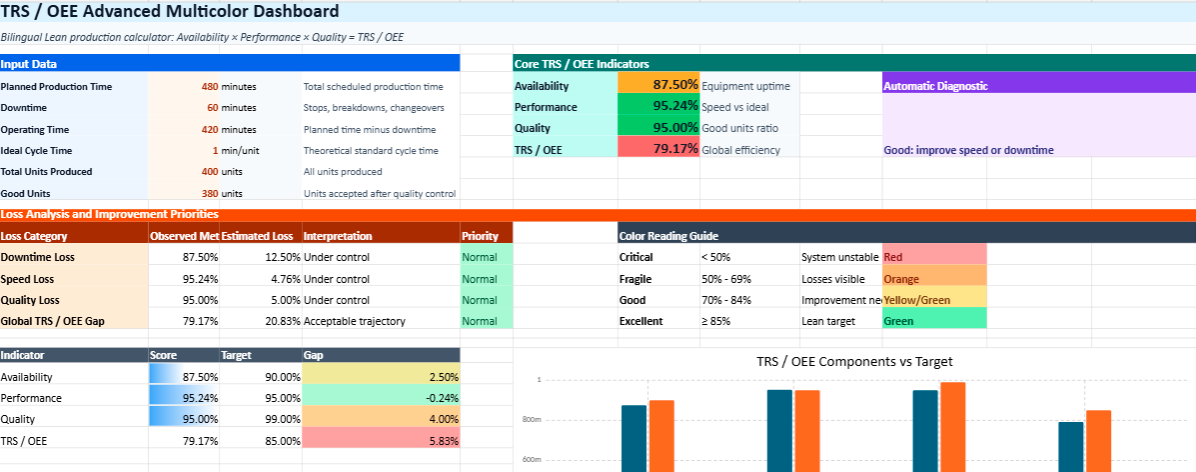
OEE Excel Model – A Simple Way to See What’s Really Happening in Production
Understanding performance on the shop floor is often harder than it should be. Data exists everywhere, yet turning it into something clear and useful can feel overwhelming. This Excel model changes that. It brings everything together on a single page, making it easy to see, in just a few seconds, how well a production line is truly performing.
A layout that makes sense instantly
Nothing feels hidden or complicated. The structure follows a natural logic:
a space to enter your production data
an area where calculations happen automatically
a clear display of key indicators
a visual zone that helps interpret the results
There is no need to switch between sheets or search for formulas. Everything is visible, which makes daily use much smoother.
No calculations to worry about
Once the numbers are entered, the file does the rest.
Availability, Performance, Quality, and the final OEE score are calculated automatically. This removes a common source of frustration: manual formulas and the risk of errors.
Instead of focusing on calculations, attention stays where it should be — on understanding what the numbers are saying.
Colors that speak immediately
One of the strongest aspects of this model is how quickly it communicates performance.
Green suggests things are running smoothly
Yellow or orange signals that something needs attention
Red highlights areas where action is urgent
There is no need to interpret complex tables. A simple glance is enough to understand the situation.
Seeing where performance is lost
The model does more than show a final score. It helps answer a more important question: where are the losses coming from?
If availability is low, downtime is likely the issue
If performance drops, speed or small stops may be the cause
If quality decreases, defects or rework are probably involved
This clarity makes it easier to move from observation to action.
Designed for real, everyday use
This is not a theoretical tool. It fits naturally into daily production routines:
during shift handovers
in team meetings
when reviewing line performance
when discussing improvement actions
Because it is simple and visual, it can be used by operators, supervisors, and managers alike.
A tool that supports better decisions
Over time, this model becomes more than a dashboard. It turns into a reference point.
Teams start to:
track performance trends
notice recurring issues
react more quickly to problems
align around the same indicators
Instead of working with assumptions, decisions are based on something concrete.