🔧 MTTR Tracker in Excel– Maintenance Efficiency at a Glance
Although MTBF provides insight into failure frequencies, MTTR holds the answer to an equally pertinent question: how swiftly can our repairs be carried out?
It proves a pivotal measure that illuminates the adeptness and reactiveness of maintenance functions—and typically brings more to light than anticipated. The rate at which problems are put right paints a telling picture of how well-oiled recovery mechanisms are. While breakdowns will occur, being rapid to remedy prevents issues snowballing into larger hindrances.
🔍 What is MTTR, Really?
Mean Time to Repair is a telling metric for any maintenance operation. It offers a glimpse into how swiftly issues can be addressed and systems restored to full functionality once problems arise. The speed at which failures can be diagnosed, fixed and the equipment reignited encompasses event identification to final resolution.
However, MTTR illuminates more than just repair performance – it shines a light on readiness across the team, the deftness of workflows, and the nimbleness to change course on the fly. By consistently clocking MTTR, frankly assessing what it shows, and reacting intelligently, a maintenance team can transform from reacting to issues to strategizing how to avoid them or their fallout in the first place. Proactive maintenance is the prize for organizations that review and respond to what their Mean Time to Repair is actually revealing.
Here’s the simple formula:
MTTR = Total Downtime from Failures ÷ Number of Failures
Let’s say a piece of machinery goes down 5 times in a month, and the total time spent on repairs is 20 hours.
Your MTTR would be:
20 ÷ 5 = 4 hours
That means, on average, it takes your team 4 hours to bring that equipment back online after each failure.
🧠 Why MTTR Should Be on Your Radar
Tracking MTTR helps you answer questions like:
- Are we responding quickly enough to equipment failures?
- How efficient is our troubleshooting process?
- Are delays happening because of diagnostics, parts, or personnel?
A lower MTTR typically reflects a well-trained team, streamlined workflows, and accessible spare parts.
A higher MTTR may point to procedural gaps, insufficient training, or logistical slowdowns.
🛠️ How MTTR Influences Maintenance Strategy
✅ 1. Response Readiness
MTTR highlights how prepared your team is when something fails. Delays often reveal whether the issue is people, process, or supply chain.
✅ 2. Spare Parts Planning
If repairs are slowed by parts unavailability, MTTR will reflect that. Reviewing high MTTR trends can justify smarter inventory strategies.
✅ 3. Workforce Efficiency
Long repair times may suggest a need for additional training, better diagnostic tools, or more detailed equipment documentation.
✅ 4. SLA and Compliance Monitoring
MTTR is often used in service level agreements (SLAs). Staying within a targeted MTTR can be critical for contracts and quality standards.
📝 What MTTR Includes (and Doesn’t)
MTTR includes:
- Time spent diagnosing the issue
- Time locating and retrieving parts
- Actual repair work
- Testing and restarting the equipment
It doesn’t include:
- Time the machine was running normally
- Time waiting for a technician if the ticket wasn’t issued
- Any planned downtime like scheduled maintenance
🧾 A Practical Example
Imagine your conveyor system breaks down three times in a week:
- First repair takes 2 hours
- Second takes 4 hours
- Third takes 3 hours
MTTR = (2 + 4 + 3) ÷ 3 = 3 hours
This average helps you set realistic expectations for production recovery and shows you where response times may be improved.
📊 MTTR vs. MTBF: Know the Difference
- MTBF (Mean Time Between Failures) = How often equipment fails
- MTTR (Mean Time to Repair) = How quickly it gets fixed
Together, they provide a powerful lens into equipment reliability and maintenance performance.
Want to reduce downtime? Improve both.
🔧 How to Reduce MTTR
Here are some practical steps:
- Standardize troubleshooting procedures
- Train technicians on specific asset types
- Ensure spare parts are easy to find and order
- Use CMMS tools to document, track, and analyze repair times
- Keep clear logs of failure causes and resolution steps
Each small improvement adds up to faster recovery and fewer production interruptions.
🛠️ MTTR Unpacked: What It Truly Tells You About Maintenance Effectiveness
When something breaks down in an industrial setting, the obvious question is: how rapidly can we get it operating again? That’s where MTTR — Mean Time to Repair — comes in. It’s not just a metric; it’s a window into how reactive, knowledgeable, and prepared your maintenance operation truly is.
Let’s breakdown it in realistic terms, the way a maintenance team would discuss it on the floor.
⚙️ What Is MTTR, Really?
MTTR measures the average length of time it takes to fix a system or component after a failure. It begins when the failure is detected and ends when the equipment is fully restored and back in operation. Here’s the basic formula:
MTTR = Total Downtime ÷ Number of Repairs
Let’s suppose your maintenance team handles 5 breakdowns over a week, and the total downtime adds up to 10 hours. Then the MTTR would be:
MTTR = 10 ÷ 5 = 2 hours
On average, it takes 2 hours to get things up and running after a breakdown.
🤔 Why Should You Pay Attention to MTTR?
Because every hour a machine is down is an hour of lost production, missed targets, or additional labor costs. MTTR tells you how quickly your team can respond, troubleshoot, and restore equipment—and that reflects everything from their technical abilities to how well-stocked your parts inventory is.
A low MTTR means your team is fast, effective, and efficient. A high MTTR? That’s a sign to dig deeper: Are spare parts missing? Are diagnostics taking too much time? Is training lacking?
🧠 What MTTR Actually Reveals
Here’s what MTTR helps you assess:
- Responsiveness: How rapidly your team reacts to failures once they’re detected.
- Repair process efficiency: Are repair steps streamlined, or are there avoidable delays?
- Support readiness: Are your teams, tools and components prepared for inevitable issues?
- Recurring troubles: Could prolonged repair times stem from underlying mechanical faults reoccurring?
🔁 MTTR versus MTBF: Clarifying a common mix-up
Let’s clear a frequent confusion:
MTBF (Mean Time Between Failures) concerns failure frequency.
MTTR focuses on restoration speed.
Consider MTBF as a gauge of “reliability” and MTTR as a measure of “preparedness”.
Together they provide a full picture, apart neither fully informs.
📋 Best practices for MTTR measurement
Consistency is paramount for productive MTTR monitoring:
- Begin tracking at failure logging—not technician arrival.
- End timing solely when full operation returns.
- Individually record each repair and use sufficient data for a fair average.
- Exclude delays immaterial to your process, like production approvals, unless integral.
🧩 Real-world example
Suppose a bottling machine stalls thrice in a week:
Initially down 1.5 hours
Second time 2 hours
Third for 1 hour
That’s 4.5 hours total downtime.
MTTR = 4.5 hours ÷ 3 failures = 1.5 hours
Such stats allow benchmarking efficiency, planning and bottleneck identification.
📈 Approaches to shorten MTTR
Want reduced MTTR and less downtime? Start with:
- Standardized repair procedures and troubleshooting guidance.
- Investment in comprehensive maintenance training.
- Stocking frequently needed spare parts to avoid supplier waits.
- Digital tools to instantly log issues, assign tasks and automatically track time.
🎯 In essence
MTTR signifies more than speed—readiness, effectiveness and control are crucial too.
While mean time to repair can efficiently handle equipment issues as they arise, taking full advantage involves optimizing the entire maintenance workflow. Shortening downtime requires more than swift responses – it demands continuously enhancing collaboration across roles. Pairing MTTR with metrics such as mean time between failures and uptime empower strategic priorities with reliability as the guiding principle. When maintenance is a well-oiled machine in itself, equipment performance and production stability are reinforced from design through daily operations.
🔧 MTTR Tracker – Maintenance Efficiency at a Glance
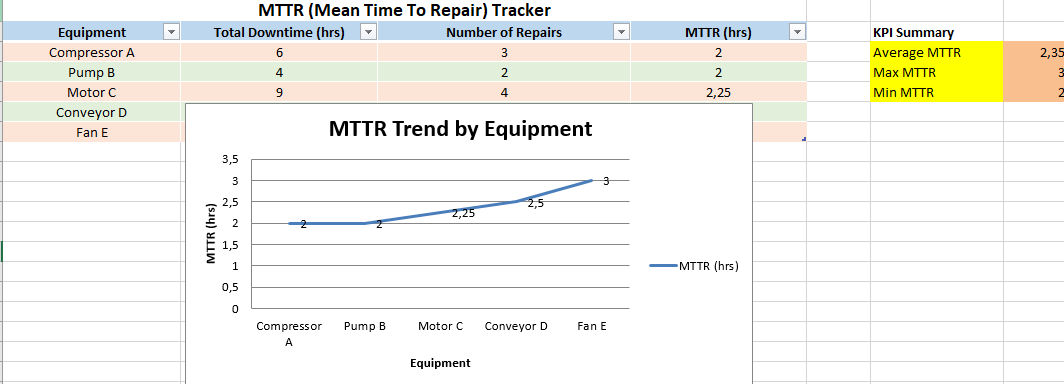
This tracker automatically calculates the Mean Time To Repair (MTTR) for each piece of equipment using this core formula:
MTTR = Total Downtime ÷ Number of Repairs
Simply input the total hours equipment was down and how many times it was repaired. The MTTR field updates instantly with the result.
Key Features
1. Auto-Calculating MTTR Column
- Just update the “Downtime” and “Repairs” fields.
- The “MTTR” column recalculates automatically—no manual math needed.
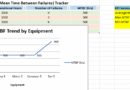
2. Dynamic Trend Chart
- A built-in line chart visualizes MTTR trends across equipment.
- Chart updates in real time as data is modified, helping you spot slowdowns or improvements instantly.
3. Performance KPIs
- Summary section auto-displays:
- Average MTTR
- Maximum MTTR
- Minimum MTTR
- Gives managers and supervisors a quick snapshot of current performance.
4. Filterable Equipment Table
- Built-in Excel table functionality:
- Sort or filter by equipment name, downtime, or repair counts.
- Easy to isolate high-priority assets or investigate slow repairs.
5. Color-Coded Layout
- Alternating row colors for easy reading.
- Bold headings and grouped sections enhance usability.
Why Use This Tracker
With this MTTR tracker, you can:
- Identify bottlenecks in your repair process
- Benchmark technician response and efficiency
- Optimize resource planning and spare part readiness
- Reduce prolonged downtime with data-driven decisions